


04162021 :: Friday finance

A partial digest:
Friday was day 87 of the Biden-Harris administration. Russia shall be blocked.
Inflation as measured by CPI went up, yields went down, gold lagged, crypto went up. Yes, yields declined in the face of real inflation data after all the superficial connections that were drawn between them rising, and incoming inflation and “recovery,” i.e. the so-called “reflation trade.” Then gold, the incessantly touted but totally unreliable inflation asset, barely responded (at first). In the case of crypto, so much is going on all the time that it’s impossible to say that hedging inflation is what drove it to new heights.
There’s a major issue with the data, though: The YoY comparison is to low numbers from last year when the pandemic really landed. As one Fed governor put it, the jump is “mechanical” (and most likely ephemeral).
Whatever the CPI numbers, Fed officials have already said it's not enough. In the eventuality that we finally end up with lasting systemic inflation someday—which could still remain elusive—equities and energy, as stated multiple times here in the past, are historically the most proven hedges. For now, it should be clearer every time that markets overreact.
With all the above in mind, crude finished up for the week while US equity indices kept reaching for new all-time highs.
[tracking: SPXL, VTI, QQQ, XLK, XLE, MCHI]Quick wrap:
The J&J vaccine was put on hold for its potential role in causing cerebral blood clotting and corresponding treatment.
In spite of CPI inflation, yields finished down for the week. There was a big short in place after all, spearheaded by hedge funds, as well as continued foreign selling of Treasuries in the month of February. Apparently China in particular has been eating it up, though, buying the dip and saying thanks for the discount all the while. Theories on why yields are now falling include historical precedence.
Simultaneously, the DXY declined to slightly above 91.5.
Crude finished up for the week.
CALL: No change; near to semi-intermediate term, prices could rise further given supply shocks, OPEC+ micromanagement, inflation expectations, "recovery," and more fiscal spending, among other things. Longer term, it's a dying industry.[tracking: XLE, GUSH, DRIP]US indices reached for new all-time highs.
Total crypto market cap is above $2.02 trillion as of publication. Grayscale bought into an ETF company and filed to change the ticker to BTC, and another use-case for blockchain by a major organization surfaced.
Gold finished the week higher.
CALL: No change; expecting ever-lower valuations moving forward. Looking for an eventual floor around $1,200/oz.
The US will withdraw from Afghanistan in an attempt to close the book on the longest armed conflict the nation has ever been involved in.
Over the weekend, cryptoassets across the board took a hit. Many credited a tweet from the account FXHedge with the selloff.
 U.S. TREASURY TO CHARGE SEVERAL FINANCIAL INSTITUTIONS FOR MONEY LAUNDERING USING CRYPTOCURRENCIES -SOURCES
Much was put on display:
Crypto fam startles easily.
So long as crypto is essentially unregulated, this may happen again and again.
The crypto markets are easily manipulated.
Things to keep in mind:
Money laundering is going on all the time no matter what the means. It is not unique to crypto.
This latest price action made for a good buying opportunity.
Initial jobless claims fell considerably to 576k (SA) for the week ending April 10 from a upwardly revised 769k for the week prior. One year ago, we saw over 4.8 million. To repeat, we are now in the one year ago timeframe when the US began to feel the brunt of the pandemic. The four week moving average came in at 683k.
To add to this, almost 132k on an unadjusted basis applied for PUA, down from the previous week’s upwardly revised 152k+.
As of March 27, nearly 17 million people (UA) were still claiming unemployment benefits of some kind, down 1.2+ million from the week prior. In the comparable week one year ago, the US witnessed close to 8.2 million people claiming unemployment insurance from all programs together.
For the most part, UI benefits programs saw declines in continued claims for the week in question from the week prior.
These are still troubling numbers.
Mortgage applications decreased a blended 3.7% (SA) for the week ending April 9, due to a decrease of 5% in refis and 1% in homebuyer applications. ARM activity fell slightly to 3.6% of all applications.
The release once again neglected to mention the average loan size across purchase applications. MBA’s choice for a 30Y fixed benchmark increased to 3.27%. The simple national average as reported by Freddie Mac (via FRED) for April 8 was 3.04% on the 30Y fixed, down from that reported last week.
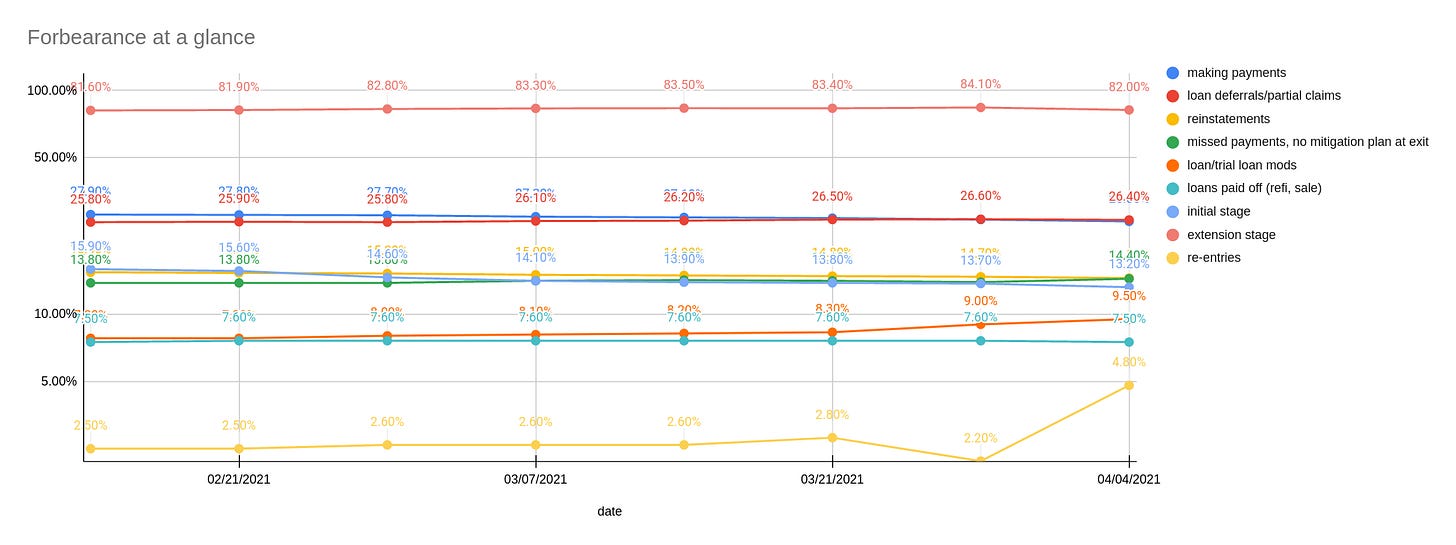
At the same time, the forbearance rate as of April 4 fell slightly to 4.66% as more households made their exit in one way or another. Exits, the good, the bad, and the ugly, are picking up as we mark one year plus of being beset by the pandemic in the US.
Forbearance re-entries jumped this last go around, as did loan/trial loan modifications and the share of people exiting with no loss-mitigation plan in place after having missed payments. Finally, the group that continues to make their monthly payments during their forbearance period shrunk yet again.
MBA estimates that 2.3 million households remain in a state of mortgage forbearance.
Meanwhile, on the construction side, housing starts jumped for the month of March. This could ease pressure on rising home prices and facilitate further buying, but then again, it could be a wash with the rising costs of lumber, copper, and other construction inputs.
CALL: No change; housing weakness inbound. For the call to reverse, labor conditions would have to consistently improve, among other things. A giantinfrastructurebill could help.[tracking: DRV, XLRE, SPG, VNO, WPG, NLY]

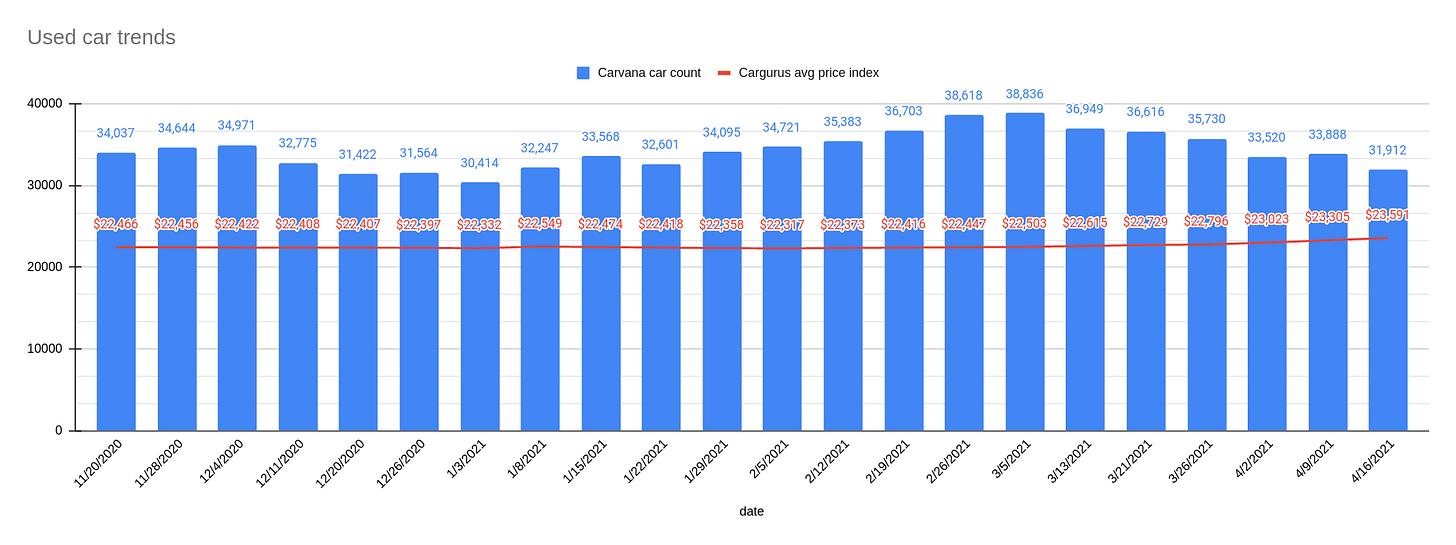
Used car trends: The latest Carvana car count as of April 16 declined 5.83% to 31,912 vehicles from 33,888 the week prior. Meanwhile, the CarGurus average price index continued rising, this time by 1.23% to $23,591 from $23,305. This is a new high for the index since said data collection began for this newsletter in November of last year.

Sovereign matters:
China’s YoY GDP growth figure was big at 18.3% as it climbs its way out of the pandemical hole. However, while it projects 6%+ growth for the coming year, the simple trend line is approximating 5% over time. All the same, and in spite of everything impacting the globe, China’s full year 2020 growth was still positive at 2.3%.
Fitch has revised Macao’s credit outlook to stable as it expects the nation to benefit from a rebound in gaming tourism. This year, the industry is projected to recover to just half of what it was pre-pandemic, picking up speed in the second half of the year. Macao’s public finances have stayed strong, but any further recovery depends on easing international travel restrictions, vaccine rollout, and virus containment, among other things.
[tracking: MCHI, EDC/EDZ, VWO, EWU, IEV]The current state of equity: A new Fed study confirms that businesses of color face severe barriers to funding.
During the pandemic alone, the US has witnessed 207,038 fatalities strictly classified as “pneumonia” with no acknowledgement of COVID-19 on the death certificates, per CDC excess deaths data. This equates to an average of 437 people per day since the start of 2020. As the CDC points out, many of these could be miscategorized COVID-19 fatalities going unrecognized in official tallies, meaning we’re undercounting. This, in addition to the official coronavirus death toll of 560,486, puts the probable COVID-19 death figure somewhere north of 670k.
Across all causes of death, we suffered 119% of the deaths in 2020 that we would have expected in non-pandemic times given historical trends. Along with other situations where COVID-19 was not designated as a cause of death but where SARS-CoV-2 likely triggered a condition or exacerbated a preexisting one—heart disease, hypertension, diabetes, dementia—the “real” fatality count is probably much higher.1
When the average of “pneumonia” deaths per day begins to decline significantly and consistently, perhaps we'll be able to start saying that we might be gaining the upper hand on SARS-CoV-2. We’re not there yet.
NPR reports that some 24.8% of the population in the US has been fully vaccinated, up from 19.9% last week. The vaccination rate was roughly 2%/week for a few weeks, then 3%/week for a couple of weeks, and now appears to be accelerating further to 5%/week.

Per the CDC, these are the states and territories that lead in vaccinating their populations versus those that lag.
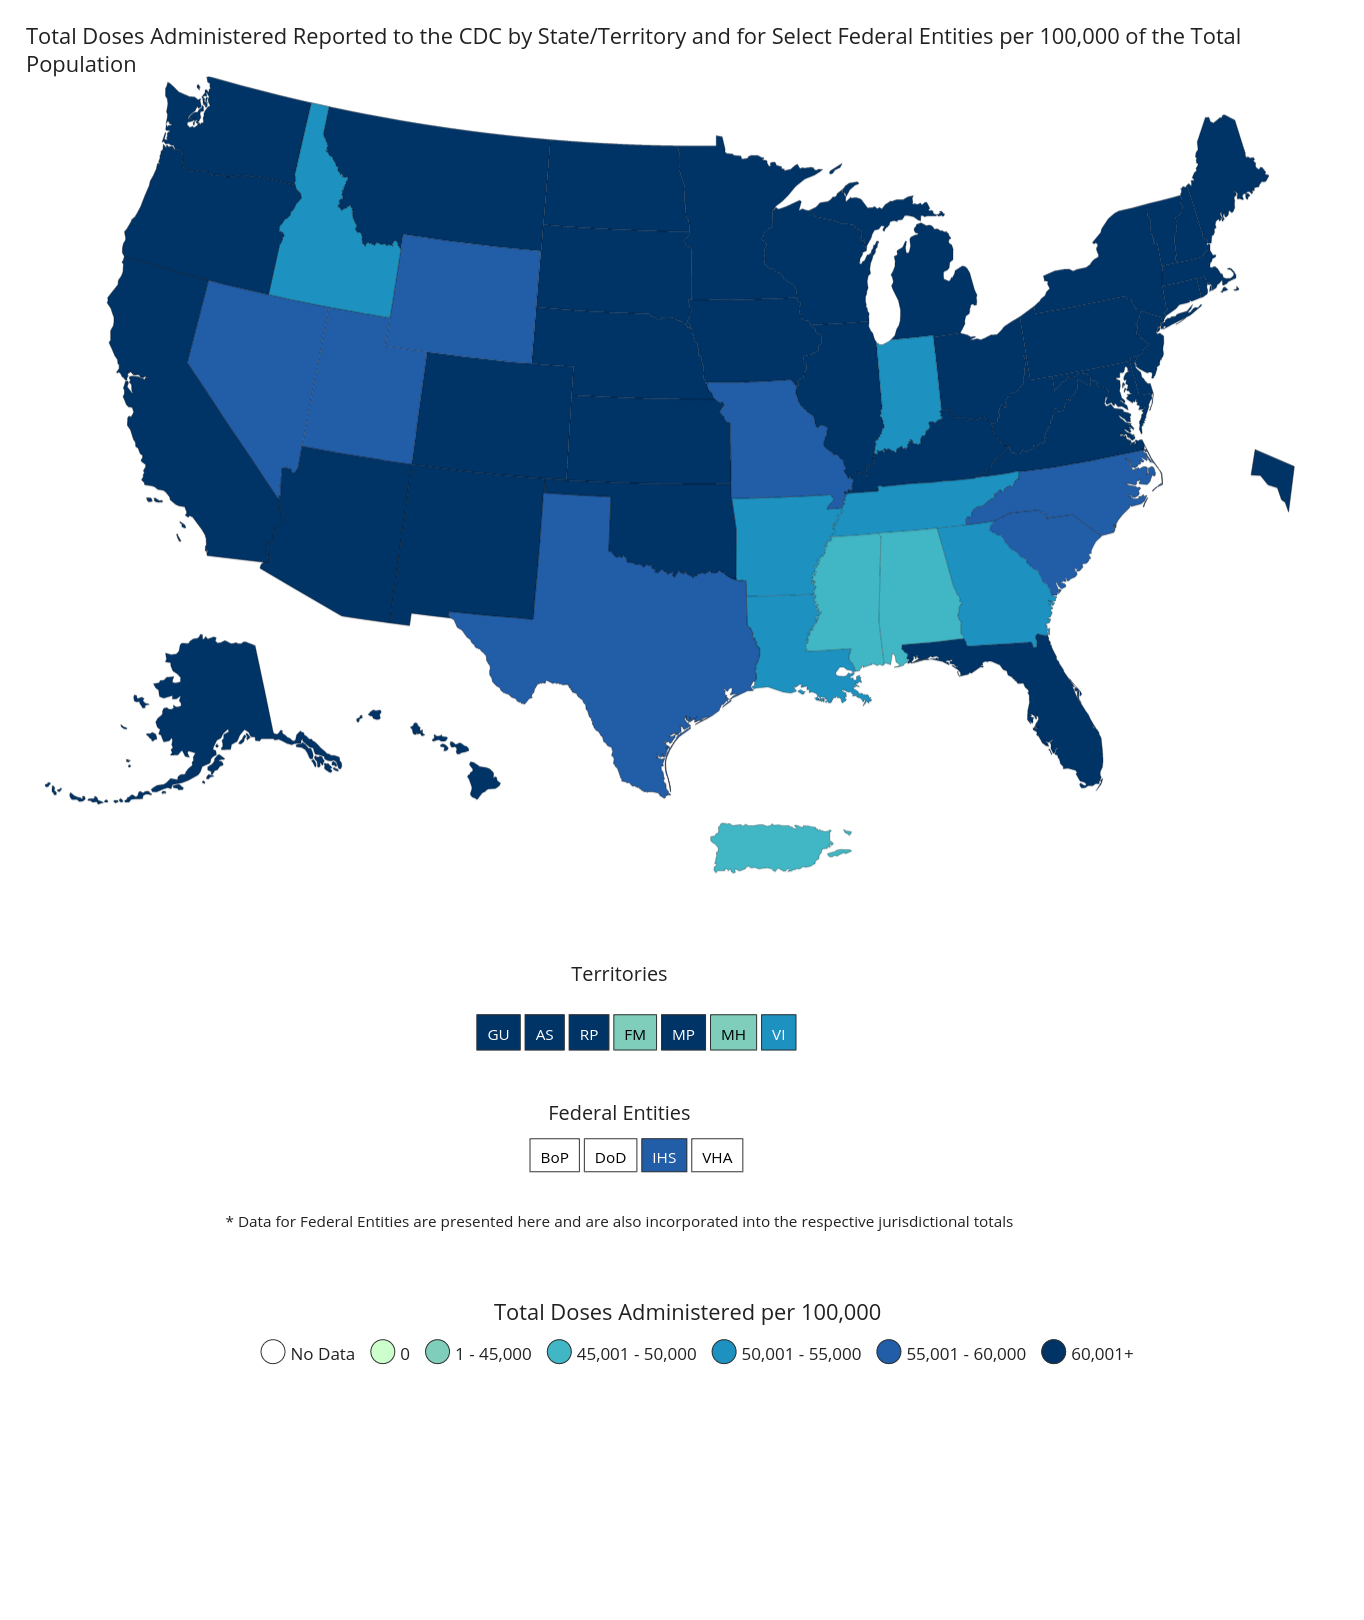


Especially in the states that lag, it is reported that vaccine supplies are gathering dust due to local resistance to getting vaccinated. At least some of these states require that one is a resident of the state to receive a vaccine there, so while folks in some states cannot get vaccination appointments when they want them, doses sit idle in other states with nobody to take advantage of them.
Footnotes
Valenta, Philip. “Death by COVID-19 Hides in Plain Sight.” HedgeHound (June 29, 2020). The research includes the full methodology behind the figures presented here every week, as well as information on historical pneumonia trends and death categorization in the US during the global pandemic. It was last updated on December 4, 2020.