


06252021 :: Friday finance

A partial digest:
American infrastructure spending is supposedly nearer at hand (or is it?), and US indices just keep climbing, which is just sketching some people out.

Quick read for the week ending June 25:
Yields rose to finish out the week, with the 10Y ending at 1.533.

The DXY finished at 91.809, down for the week.

Oil finished up. It’s at levels not seen since 2018.

CALL: No change; near to semi-intermediate term, prices could rise further given supply shocks, OPEC+ micromanagement, inflation expectations, "recovery," and more fiscal spending, among other things. However, it's beginning to look expensive. Longer term, it's a dying industry.[tracking: XLE, GGN, SCO, DUG, DRIP]The S&P Global Clean Energy index finished up for the week.

[tracking: TAN]Gold finished up for the week, though it remains sub-$1,800.

CALL: There may be traders who persist in calling the competence of the Fed and US Treasury into question, and in so doing seek to drive gold and silver prices higher once again. However, there is no change to the call here; the expectation remains for ever-lower valuations moving forward. Looking for an eventual floor around $1,200/oz.[tracking: JDST, GLL, ZSL, GGN, GLD, GDX, SLV]Commodities finished mostly up for the week.
The St. Louis Fed Financial Stress Index (STLFSI2) for the week ending June 18 ticked up again to -0.9253 from -0.9790 the week prior. It remains well below zero, or the stress the economy experiences under “normal financial market conditions.”

Total crypto market cap was 1.281 trillion as of June 25, meaning outflows of about $202 billion since last reading.

[tracking: ETH, LTC, LINK, DOGE, ADA, VET, LUNA, ALGO, DOT, XLM, UNI, UMA, YFI, COMP]


Flows for the week ending June 23, per Refinitiv Lipper data:1
Global money market funds witnessed a huge outflow of $58.9 billion.
Global bond funds realized inflows of a smaller $$3.5 billion, relative to before. Inflows into inflation protection bonds nearly trickled out.
Global equities saw inflows of $22.9 billion, with much of that going to US markets, though eurozone equities saw $3.4 billion and Asian $1.8 billion. Tech saw inflows while financials saw larger outflows of $2.36 billion.
US money markets saw outflows of $29.5 billion.
US bond funds realized inflows of $2.8 billion. Taxable bonds witnessed inflows of $2.06 billion; munis, $1.73 billion.
US equities saw large inflows of $16.1 billion. Growth gained a total of $1.5 billion, while value lost $2.4 billion.
Emerging market stocks realized outflows of $183 million, while EM bonds shed $1.23 billion.
Precious metals saw outflows of $215 million.
Initial jobless claims in the US for the week ending June 19 declined to 411k (SA) from an upwardly revised 418k for the week prior. One year ago, we saw 1.460 million. We are now in the one year ago timeframe where the US has been square in the grips of the pandemic. The four week moving average increased to 397.8k.
To add to this, just over 104.6k on an unadjusted basis applied for PUA, up from the previous week’s 97.7k+.
As of June 5, 14.845 million people (UA) were still claiming unemployment benefits of some kind, up about 3.8k from the week prior. In the comparable week one year ago, the US witnessed nearly 31.338 million people claiming unemployment insurance from all programs together.
The PEUC UI benefits program saw the biggest increase (107.9k+) from the previous week.
These numbers are still cause for concern, although we have now dropped and remain below last year’s number of total continued claims for the comparable week.

Mortgage applications increased a blended 2.1% (SA) for the week ending June 18, due to an increase of 3% in refis and 1% in homebuyer applications. ARM activity rose to 3.9% of all applications from 3.8% the week prior.
MBA’s choice for a 30Y fixed benchmark rose seven basis points to 3.18%. The simple national average as reported by Freddie Mac (via FRED) for June 24 rose to 3.02% on the 30Y fixed, up nine basis points from that reported the previous week.
Institutional investors keep hoovering up housing supply with an eye toward everything from single family rentals in the burbs to massive portfolios of vacation rentals in destination hot spots. The UK already went through this in the past and chose to take action to curb investor dominance in the market.
Meanwhile, the forbearance rate as of June 13 fell further to 3.93% as more households made their exit in one way or another. Exits, the good, the bad, and the ugly, continued as we marked roughly 14-15 months of being beset by the pandemic in the US.
The share of households that exited with loan or trial loan modifications grew, as did the segment re-entering mortgage forbearance. This latter percentage climbed for the fifth consecutive week, indicating that people are struggling more and more to exit—and stay out of—forbearance.
At the same time, the group that continues to make their monthly payments during their forbearance period fell again, as did the portion of loans where past-due amounts were paid back upon exit and they were reinstated.
MBA estimates that 2 million households remain in a state of mortgage forbearance.

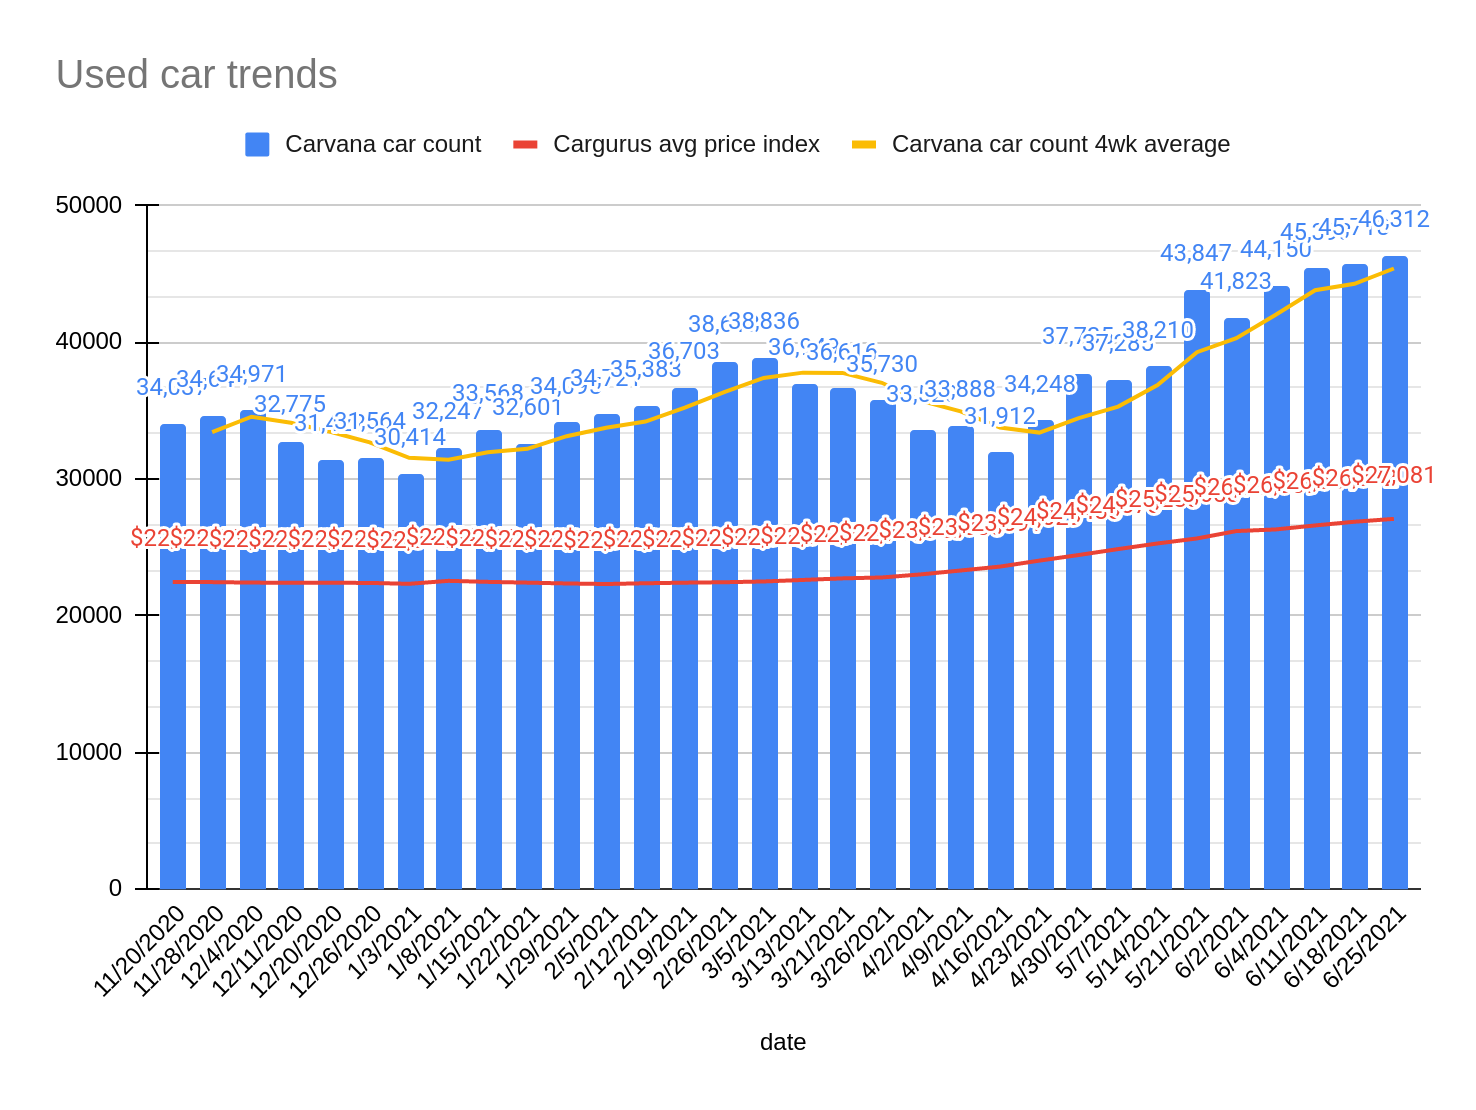
CALL: On hold. The trend of megalandlords increasingly making Americans perpetual renters rather than owners of property complicates the housing market picture.[tracking: DRV, XLRE, SPG, VNO, WPG, NLY]Used car trends: The latest Carvana car count as of June 25 rose 1.30% to 46,312 vehicles from 45,718 the week prior. The four-week moving average came in at 45,393. Meanwhile, the CarGurus average price index continued rising, this time by 0.78% to $27,081 from $26,872. This is a new high for the index since said data collection began for this newsletter in November of last year.
Of interest is that prices keep rising even as inventory swells, as evidenced by the four-week moving average rising over the last six weeks (yellow line below).

Sovereign matters:
The UK’s food supply chain is breaking down further.
The current state of equity: Chauvin finally sentenced, though other legal proceedings continue.
During the pandemic alone, the US has now witnessed 234,584 fatalities strictly classified as “pneumonia” with no attribution to COVID-19 on the death certificates, per CDC excess deaths data updated June 25. This equates to an average of 433 people per day since the start of 2020. As the CDC points out, many of these could be miscategorized COVID-19 fatalities going unrecognized in official tallies, meaning we’re undercounting. This, in addition to the official coronavirus death toll of 603,351 as of June 25, puts the probable COVID-19 death figure somewhere north of 735k.
Across all causes of death, we suffered 119% of the deaths in 2020 that we would have expected in non-pandemic times given historical trends. Along with other situations where COVID-19 was not designated as a cause of death but where SARS-CoV-2 likely triggered a condition or exacerbated a preexisting one—heart disease, hypertension, diabetes, dementia—the “real” fatality count is probably much higher.2
When the average of “pneumonia” deaths per day begins to decline significantly and consistently, perhaps we can start saying that we might be gaining the upper hand on SARS-CoV-2. We’re not there yet.
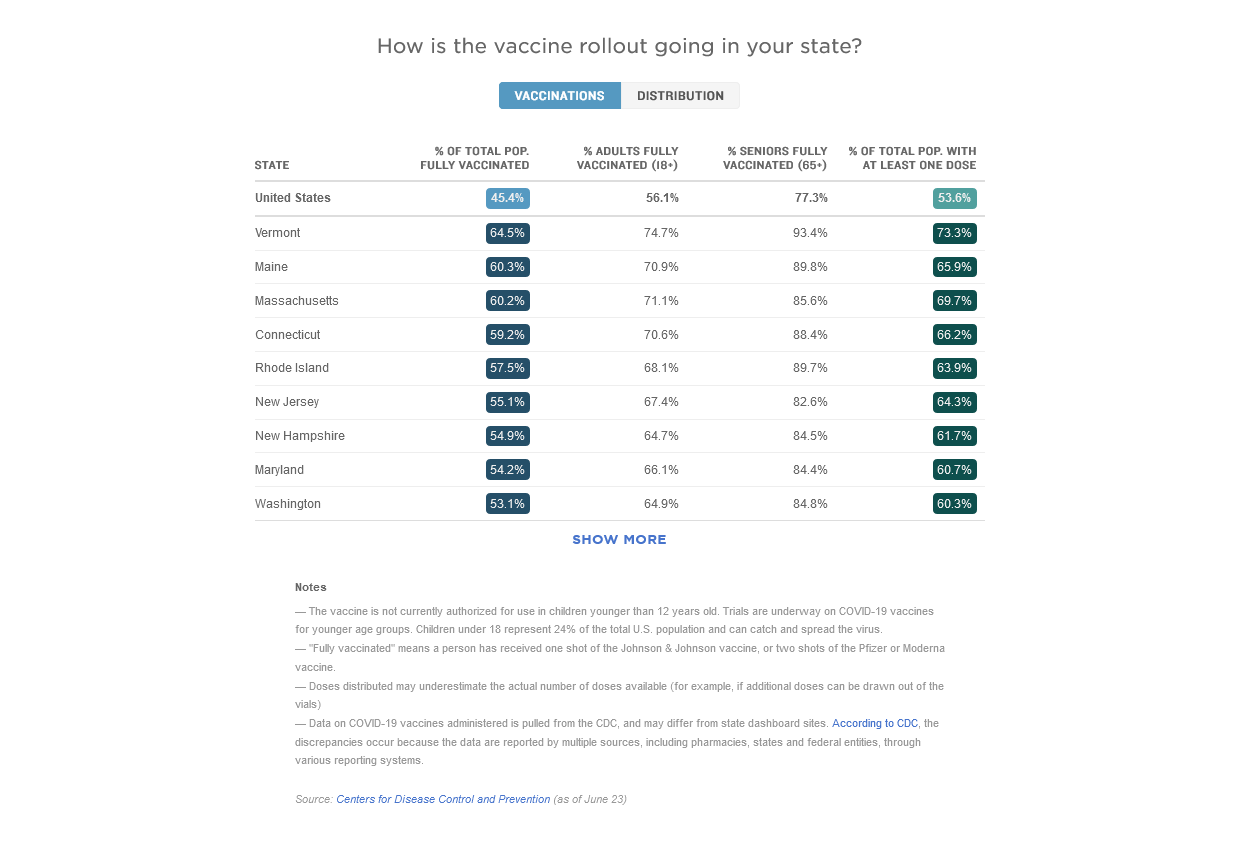
NPR reported that 45.4% of the US population was fully vaccinated as of June 23. That puts the US vaccination rate at 1.3%/week since last reading, meaning the pace remains subdued.


Footnotes
Valenta, Philip. “Death by COVID-19 Hides in Plain Sight.” HedgeHound (June 29, 2020). The research includes the methodology behind the figures presented here every week, as well as information on historical pneumonia trends and death categorization in the US during the global pandemic. It was last updated on December 4, 2020.