


06182021 :: Friday finance

A partial digest:
Many markets did not fare well this past week, the DOW and gold in particular. Premature bets continued to be placed, which is to say that many people, traders, investors, however we refer to them, have been gambling, far and wide. Meme stocks and crypto and social media users get so much attention, yet there is actually very little separating folks at this time, including the “smart money” (which rarely looks that smart anymore, if it ever did).
There are many different groups, including the group that made the premature bet that the Fed would be forced to raise rates much sooner and more often than twice in 2023 in order to contain the inflation monster. Then, there’s the group that would have made the premature bet that the Fed wouldn’t raise rates until at least 2024, after all. Both would now be thrown off by the Fed’s new guidance of adding two hikes to their 2023 forecast.

What can be said is that deep pockets have tended to adjust quickly to developments. Therefore, the different camps out there will come around, money will move, new positions will be taken. Let it be done.
Understand, though, that what the Fed has said as a unified body that is not actually unified did not materially change the economy’s prospects, nor the labor market, nor the literal or figurative fortunes of companies. Therefore, it may be worth hanging tight through any further volatility, especially in the presence of well thought out investment theses.
Quick view for the week ending June 18:
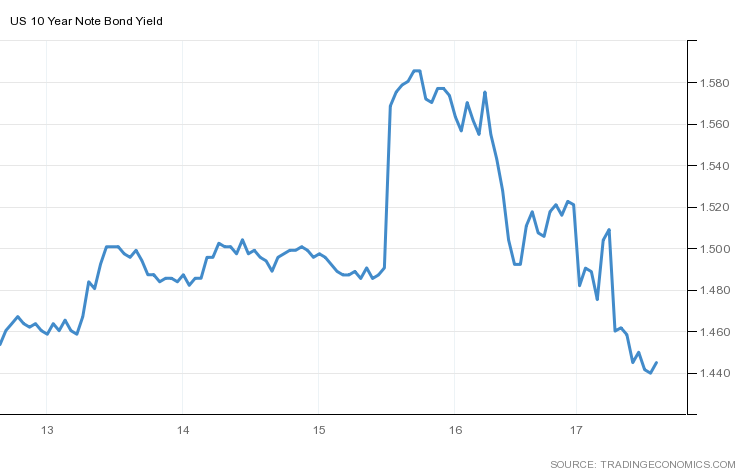
Yields were volatile this past week, but the 10Y finished only ever so slightly down from where it began.

The DXY was a big winner this past week, seeing a massive jump earlier in the week after flatlining to start it out. It continued rising to close it out.

Oil finished slightly up for the week, though off its highs mid-week.

CALL: No change; near to semi-intermediate term, prices could rise further given supply shocks, OPEC+ micromanagement, inflation expectations, "recovery," and more fiscal spending, among other things. Longer term, it's a dying industry.[tracking: XLE, GGN]The S&P Global Clean Energy index finished down for the week.

[tracking: TAN]Gold fell off a cliff, plain and simple.

CALL: While there may be traders who persist in calling the competence of the Fed and US Treasury into question, and in doing so seek to drive gold and silver prices higher once again, the tide decidedly turned on them this past week. Thus, there is especially no change to the call that has graced this newsletter for a spell, now; the expectation remains for ever-lower valuations moving forward. Looking for an eventual floor around $1,200/oz.[tracking: JDST, GGN, GDX, GLD, SLV, ZSL, GLL]Commodities finished mixed to down for the week.
The St. Louis Fed Financial Stress Index (STLFSI2) for the week ending June 11 ticked back up to -0.9790 from -1.0062 the week prior. It remains well below zero, or the stress the economy experiences under “normal financial market conditions.”

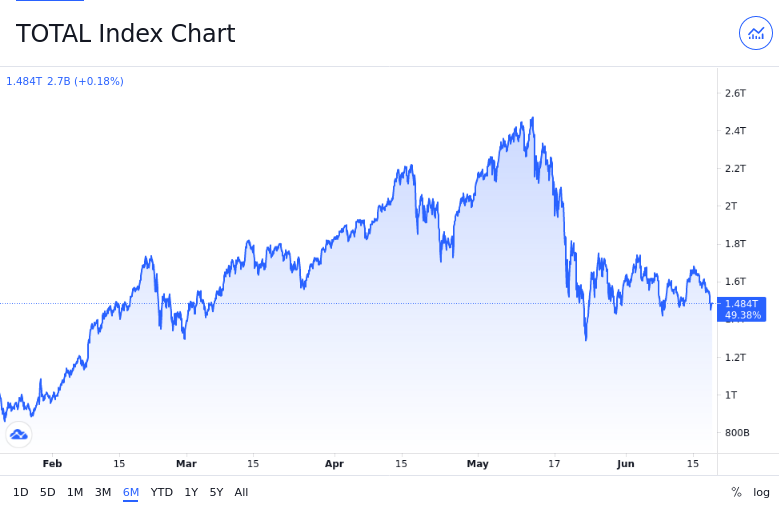
Total crypto market cap was 1.483 trillion as of the evening of June 18, meaning inflows of only about $2 billion since last reading.

Flows for the week ending June 16, per Refinitiv Lipper data:1
Global money market funds reversed course sharply and witnessed massive outflows totaling $56.6 billion.
Global bond funds realized another $9 billion of inflows.
Global equities saw renewed inflows of $10.3 billion. EU funds were the most attractive, gaining $8.6 billion, while US equities only gained $400 million and Asian stocks $1.2 billion.
US money markets saw much larger outflows this time of $26.4 billion.
US bond funds realized inflows again of $4.3 billion. Taxable bonds saw inflows of a smaller $2.7 billion; munis, $1.65 billion; inflation protection bonds, approximately $800 million; short and intermediate term investment grade, $2.63 billion.
US equities saw inflows totaling $386 million. Growth realized $1.85 billion, while value took in $1.7 billion. Real-estate attracted another $528 million of inflows.
Emerging market stocks realized inflows of $184 million, while EM bonds witnessed inflows again of $1.27 billion.
Precious metals saw small unspecified inflows, while energy outflows continued.
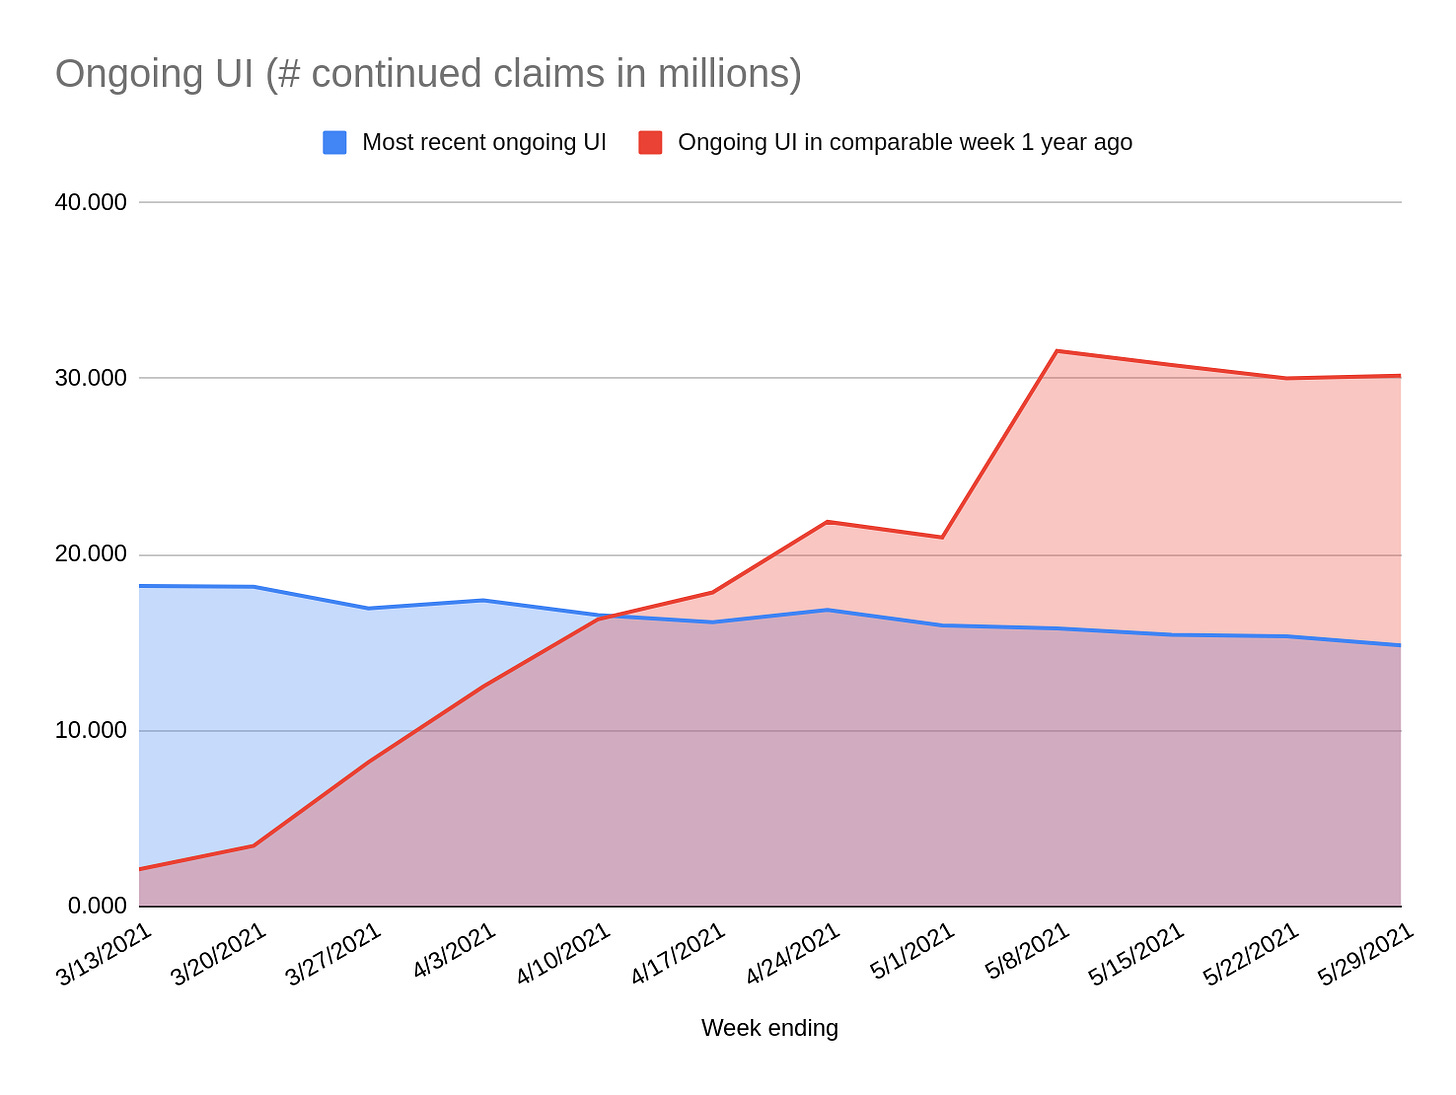
Initial jobless claims in the US for the week ending June 12 surprised observers by reversing course to rise to 412k (SA) from a downwardly revised 375k for the week prior. One year ago, we saw 1.472 million. We are now in the one year ago timeframe where the US has been square in the grips of the pandemic. The four week moving average decreased to 395k.
To add to this, over 118k on an unadjusted basis applied for PUA, up from the previous week’s downwardly revised 71.3k+.
As of May 29, 14.829 million people (UA) were still claiming unemployment benefits of some kind, down almost 560k from the week prior. In the comparable week one year ago, the US witnessed over 30.170 million people claiming unemployment insurance from all programs together.
All UI benefits programs saw declines from the previous week.
Nearly 15 million people claiming UI benefits is still cause for concern, especially as initial claims rose.
Mortgage applications rose a blended 4.2% (SA) for the week ending June 11, due to an increase of 6% in refis and 2% in homebuyer applications. ARM activity fell slightly to 3.8% of all applications from 3.9% the week prior.
MBA’s choice for a 30Y fixed benchmark decreased four basis points to 3.11%. The simple national average as reported by Freddie Mac (via FRED) for June 17 fell to 2.93% on the 30Y fixed, down three basis points from that reported the previous week.
On the other hand, mortgage applications for new home purchases for the month of May decreased 5.9%. The average loan size rose to $384k for said homes.
At the same time, the forbearance rate as of June 6 fell by a larger slice to 4.04% as additional households made their exit in one way or another. Exits, the good, the bad, and the ugly, progressed as we marked roughly 14-15 months of being beset by the pandemic in the US.
The share of households that exited having missed payments and with no loss mitigation plan in place grew, as did the portion exiting with loan or trial loan modifications and the segment re-entering mortgage forbearance. This latter percentage climbed for the fifth consecutive week, indicating that people are struggling more and more to exit—and stay out of—forbearance.
At the same time, the group that continues to make their monthly payments during their forbearance period fell again.
MBA estimates that 2 million households remain in a state of mortgage forbearance.

Elsewhere, HUD Secretary Fudge announced that the way the FHA takes student debt burdens into account in mortgage calculations when determining whether a borrower is qualified for federal loans will change. Ideally, this will reduce barriers to entry for certain would-be borrowers seeking home ownership, namely BIPOC.
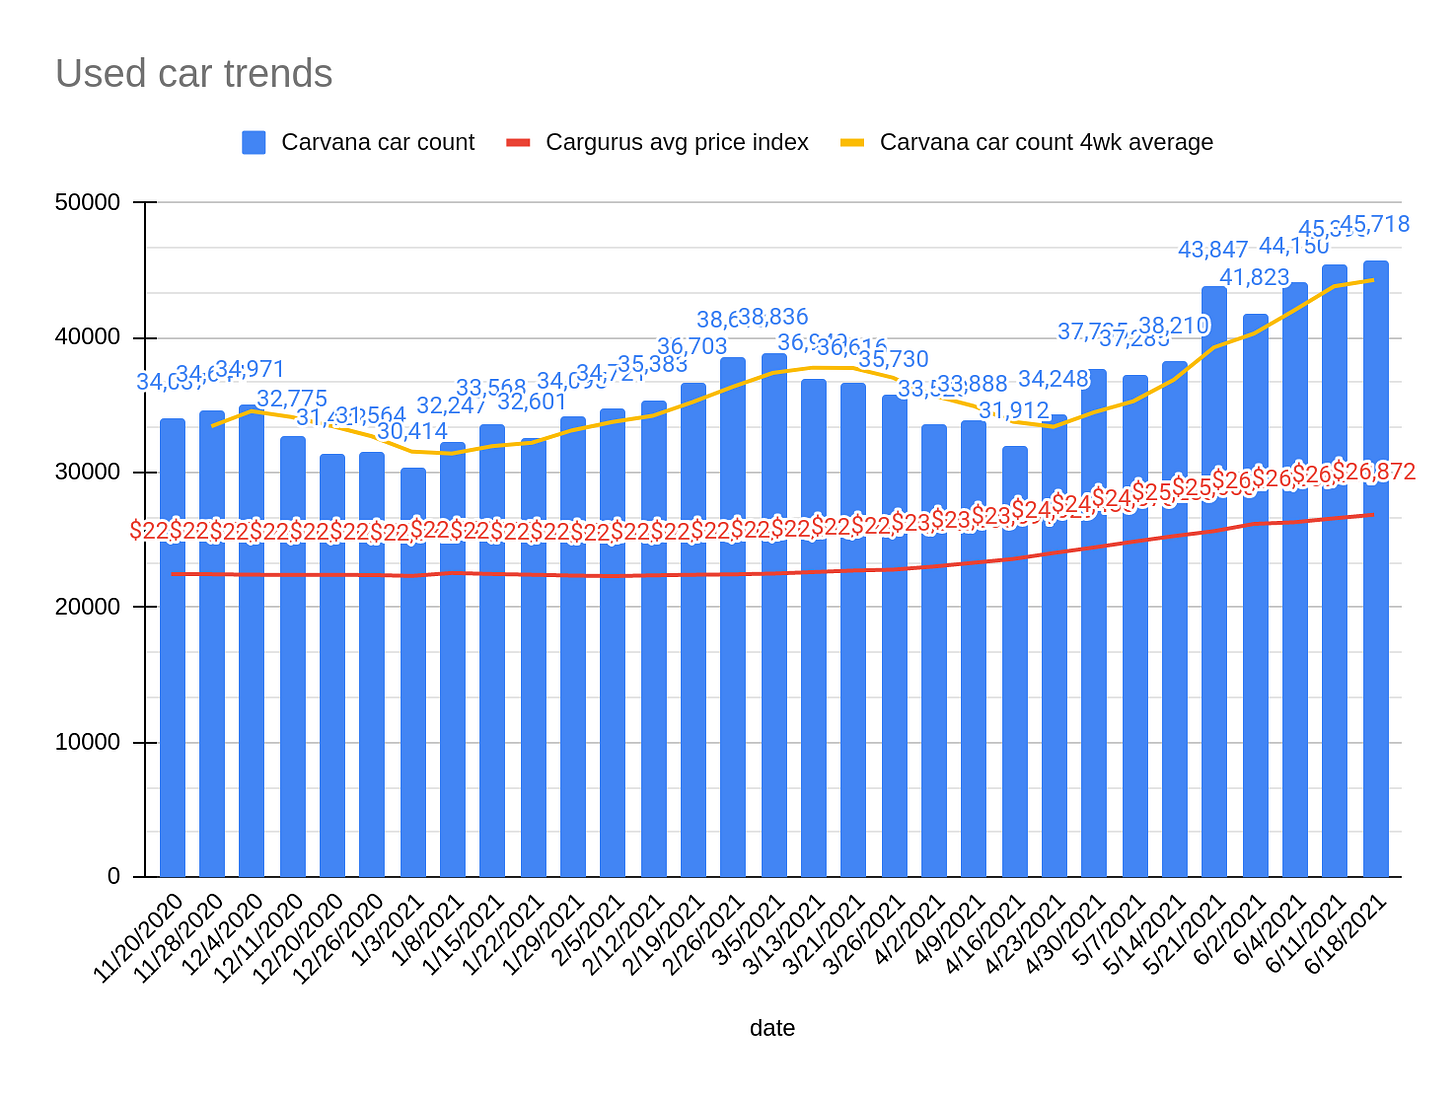
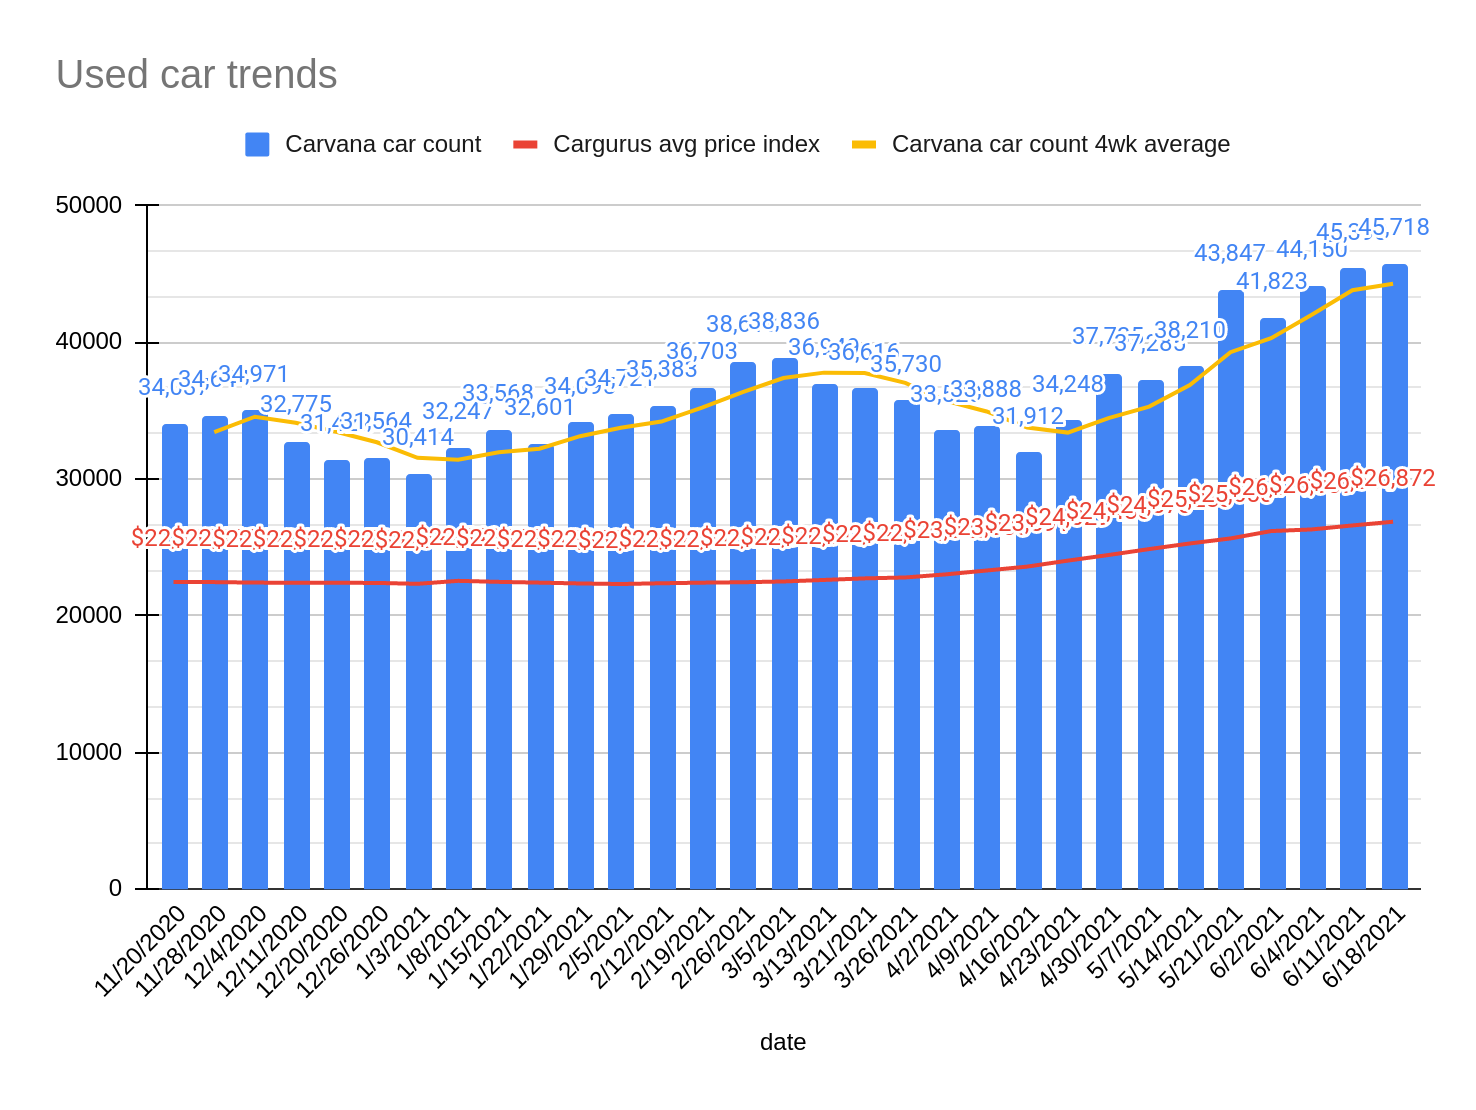
CALL: On hold. The trend of megalandlords increasingly making Americans perpetual renters rather than owners of property complicates the housing market picture. However, the bias here will likely lean back towards an incoming housing market correction.[tracking: DRV, XLRE, SPG, VNO, WPG, NLY]Used car trends: The latest Carvana car count as of June 18 rose 0.72% to 45,718 vehicles from 45,393 the week prior. The four-week moving average came in at 44,271. Meanwhile, the CarGurus average price index continued rising, this time by 1.02% to $26,872 from $26,601. This is a new high for the index since said data collection began for this newsletter in November of last year.
Of interest is that prices keep rising (red line below) even as inventory swells, as evidenced by the four-week moving average rising over the last seven weeks (yellow line below). That’s a developing mismatch.
Sovereign matters:
The G-7 is backpedaling on its more aggressive push toward a majority non-combustion vehicles on the road by 2030.
The current state of equity: Can “social change” overcome financial discrimination and sustainably boost Black-owned institutions?
During the pandemic alone, the US has now witnessed 231,668 fatalities strictly classified as “pneumonia” with no attribution to COVID-19 on the death certificates, per CDC excess deaths data. This equates to an average of 433 people per day since the start of 2020. As the CDC points out, many of these could be miscategorized COVID-19 fatalities going unrecognized in official tallies, meaning we’re undercounting. This, in addition to the official coronavirus death toll of 601,183, puts the probable COVID-19 death figure somewhere north of 730k.
Across all causes of death, we suffered 119% of the deaths in 2020 that we would have expected in non-pandemic times given historical trends. Along with other situations where COVID-19 was not designated as a cause of death but where SARS-CoV-2 likely triggered a condition or exacerbated a preexisting one—heart disease, hypertension, diabetes, dementia—the “real” fatality count is probably much higher.2
When the average of “pneumonia” deaths per day begins to decline significantly and consistently, perhaps we can start saying that we might be gaining the upper hand on SARS-CoV-2. We’re not there yet.
NPR reported that 44.1% of the US population was fully vaccinated as of June 10. That puts the US vaccination rate at 1.5%/week since last reading, meaning the pace remains subdued.


Footnotes
Valenta, Philip. “Death by COVID-19 Hides in Plain Sight.” HedgeHound (June 29, 2020). The research includes the methodology behind the figures presented here every week, as well as information on historical pneumonia trends and death categorization in the US during the global pandemic. It was last updated on December 4, 2020.