


06042021 :: Friday finance

A partial digest:
All assets reacted to the jobs data at the end of the week and what it says about economic support and any recovery. The health of the labor market, as discussed here week after week, is central to all else. Weakness there implies more need for support, which fuels various bets.
On the back of a 3.6% rise in YoY PCE for the month of April, the jobs report released Friday for May once again disappointed. High inflation readings are fleeting—a feature of the havoc the pandemic wreaked on the energy industry in particular—while the dismal state of the labor market is not.
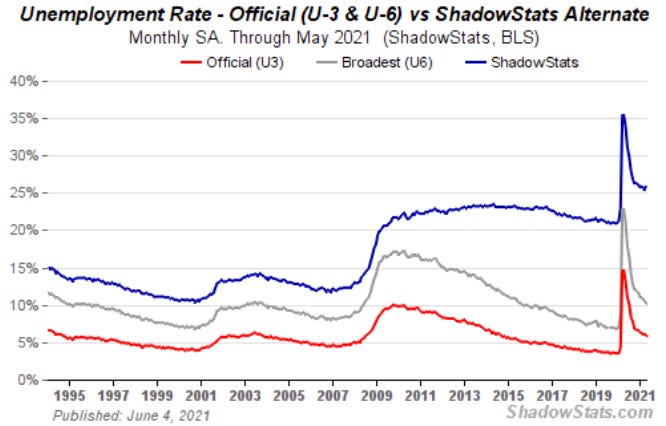
The economy added a mere 559k jobs, meaning we’re still some 7.6 million jobs shy of the February 2020 pre-pandemic peak. Meanwhile, the unemployment rate dipped to 5.8%, and the underemployment rate to 10.2%.

ShadowStats’ alternate unemployment rate for May was 26%.

The percentage of employed persons who continued to telework due to the pandemic dropped yet again, this time to 16.6% for the month of May. This is down from April’s 18.3%. Again, here’s looking at you, Zoom.
At the same time, a hefty 7.9 million people indicated they could not work because their employer closed or lost business due to the pandemic.
Quick wrap for the week ending June 4:
Yields plummeted to finish out the week, with the 10Y ending at 1.5568.

The DXY finished mostly flat after reacting to the jobs report, itself.

Oil finished strongly up, rising steadily throughout the week.
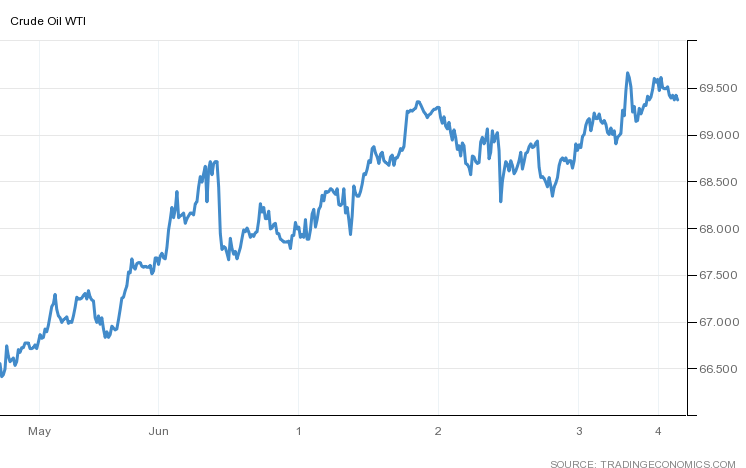
CALL: No change; near to semi-intermediate term, prices could rise further given supply shocks, OPEC+ micromanagement, inflation expectations, "recovery," and more fiscal spending, among other things. Longer term, it's a dying industry.[tracking: XLE, GGN]
The S&P Global Clean Energy index finished down for the week.

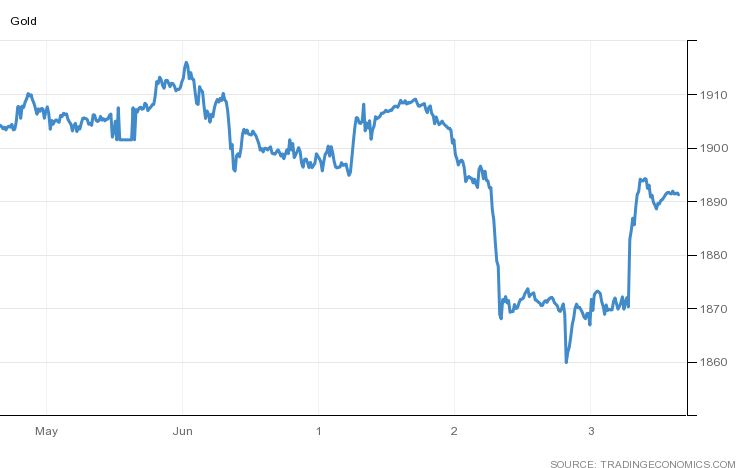
[tracking: TAN]Gold, already slipping for the week, finished down, though traders took another chance on it following the jobs report.

CALL: In the very near term, it must be acknowledged that gold has the uncertain potential to rise further as traders who call the competence of the Fed and US Treasury into question drive prices higher. Beyond the very near term, however, no change; the expectation remains for ever-lower valuations moving forward. Looking for an eventual floor around $1,200/oz.[tracking: JDST, GGN, GDX, GLD, SLV, ZSL, GLL]
Commodities finished up to mixed for the week.
The St. Louis Fed Financial Stress Index (STLFSI2) for the week ending May 28 ticked back down to -0.9691 from -0.8527 the week prior. It remains well below zero, or the stress the economy experiences under “normal financial market conditions.”
Total crypto market cap was 1.679 trillion as of June 4, meaning inflows of about $179 billion since last reading.
Flows for the week ending June 2, per Refinitiv Lipper data:1
Global money market funds witnessed further inflows for the fourth straight week, this time of $20.5 billion.
Global bond funds realized nearly double the inflows of the week prior with $15.8 billion.
Global equities saw inflows of $8 billion. Money continues to flow into financials, especially.
US money markets saw a smaller inflow of $6 billion.
US bond funds realized larger inflows of $8.1 billion. Inflation protected bonds witnessed larger inflows of $923 million; taxable, $7.57 billion; municipal, $1.37 billion.
US equities saw outflows of $3.59 billion, reversing course from the previous week. Growth lost a total of $7.42 billion, while value raked in another $2 billion. Financials likewise attracted a fair chunk of capital with inflows of $2.55 billion, as the US gets ready to drop its restrictions on the industry’s dividend payouts and buybacks come the end of June.
Emerging market stocks realized relatively large inflows of $2.56 billion, while EM bonds witnessed increased inflows of $1.6 billion.
Precious metals saw a fraction of their prior inflows with just $35 million.
Initial jobless claims in the US for the week ending May 29 declined to 385k (SA) from a downwardly revised 405k for the week prior. One year ago, we saw 1.605 million. We are now in the one year ago timeframe where the US has been square in the grips of the pandemic. The four week moving average decreased to 428k.
To add to this, just over 76k on an unadjusted basis applied for PUA, down from the previous week’s 93.5k+.
As of May 15, 15.436 million people (UA) were still claiming unemployment benefits of some kind, down over 366k from the week prior. In the comparable week one year ago, the US witnessed nearly 30.771 million people claiming unemployment insurance from all programs together.
The PEUC UI benefits program saw the biggest increase (102k+) from the previous week.
These numbers are still cause for concern, although we have now dropped and remain below last year’s number of total continued claims for the comparable week.


Mortgage applications fell a blended 4% (SA) for the week ending May 28, due to a decrease of 5% in refis and 3% in homebuyer applications. ARM activity fell to 3.7% of all applications from 4% the week prior.
MBA’s choice for a 30Y fixed benchmark decreased one basis point to 3.17%. The simple national average as reported by Freddie Mac (via FRED) for June 3 rose to 2.99% on the 30Y fixed, up four basis points from that reported the previous week.
At the same time, the forbearance rate as of May 23 fell ever so slightly to 4.18% as more households made their exit in one way or another. Exits, the good, the bad, and the ugly, slowed further as we marked roughly 14-15 months of being beset by the pandemic in the US.
The share of households that exited with loan deferrals or partial claims increased, as did the portion exiting with loans paid off through refis or home sales and the segment re-entering mortgage forbearance. This latter percentage climbed for the third consecutive week, indicating that people are struggling more and more to exit—and stay out of—forbearance.
At the same time, the group that continues to make their monthly payments during their forbearance period fell again.
MBA estimates that 2.1 million households remain in a state of mortgage forbearance.

Elsewhere in the housing market, current homeowners remain afraid to trade up given an overheating market, ensuring that things just continue to feed on themselves, for now. Speaking generally, something will have to give.
CALL: On hold. Thetrendof megalandlords increasingly making Americans perpetual renters rather than owners of property complicates the housing market picture. However, the bias here will likely lean back towards an incoming housing market correction.[tracking: DRV, XLRE, SPG, VNO, WPG, NLY]

Used car trends: The latest Carvana car count as of the time of writing rose 5.56% to 44,150 vehicles from 41,823 the week prior. The four-week moving average came in at 42,008. Meanwhile, the CarGurus average price index continued rising, this time by 0.46% to $26,309 from $26,189. This is a new high for the index since said data collection began for this newsletter in November of last year.
Of interest is that prices keep rising even as inventory swells, as evidenced by the four-week moving average rising over the last six weeks (yellow line below).

Sovereign matters:
In the wake of failed tax reforms, protests, and shifting political winds, international bond markets think Colombia’s becoming an ever riskier play, even edging out Brazil.
[tracking: EDC]The current state of equity: More evidence that Black people residing in urban areas are disadvantaged by the tax code.
During the pandemic alone, the US has now witnessed 226,709 fatalities strictly classified as “pneumonia” with no attribution to COVID-19 on the death certificates, per CDC excess deaths data. This equates to an average of 436 people per day since the start of 2020. As the CDC points out, many of these could be miscategorized COVID-19 fatalities going unrecognized in official tallies, meaning we’re undercounting. This, in addition to the official coronavirus death toll of 596,482, puts the probable COVID-19 death figure somewhere north of 720k.
Across all causes of death, we suffered 119% of the deaths in 2020 that we would have expected in non-pandemic times given historical trends. Along with other situations where COVID-19 was not designated as a cause of death but where SARS-CoV-2 likely triggered a condition or exacerbated a preexisting one—heart disease, hypertension, diabetes, dementia—the “real” fatality count is probably much higher.2
When the average of “pneumonia” deaths per day begins to decline significantly and consistently, perhaps we can start saying that we might be gaining the upper hand on SARS-CoV-2. We’re not there yet.
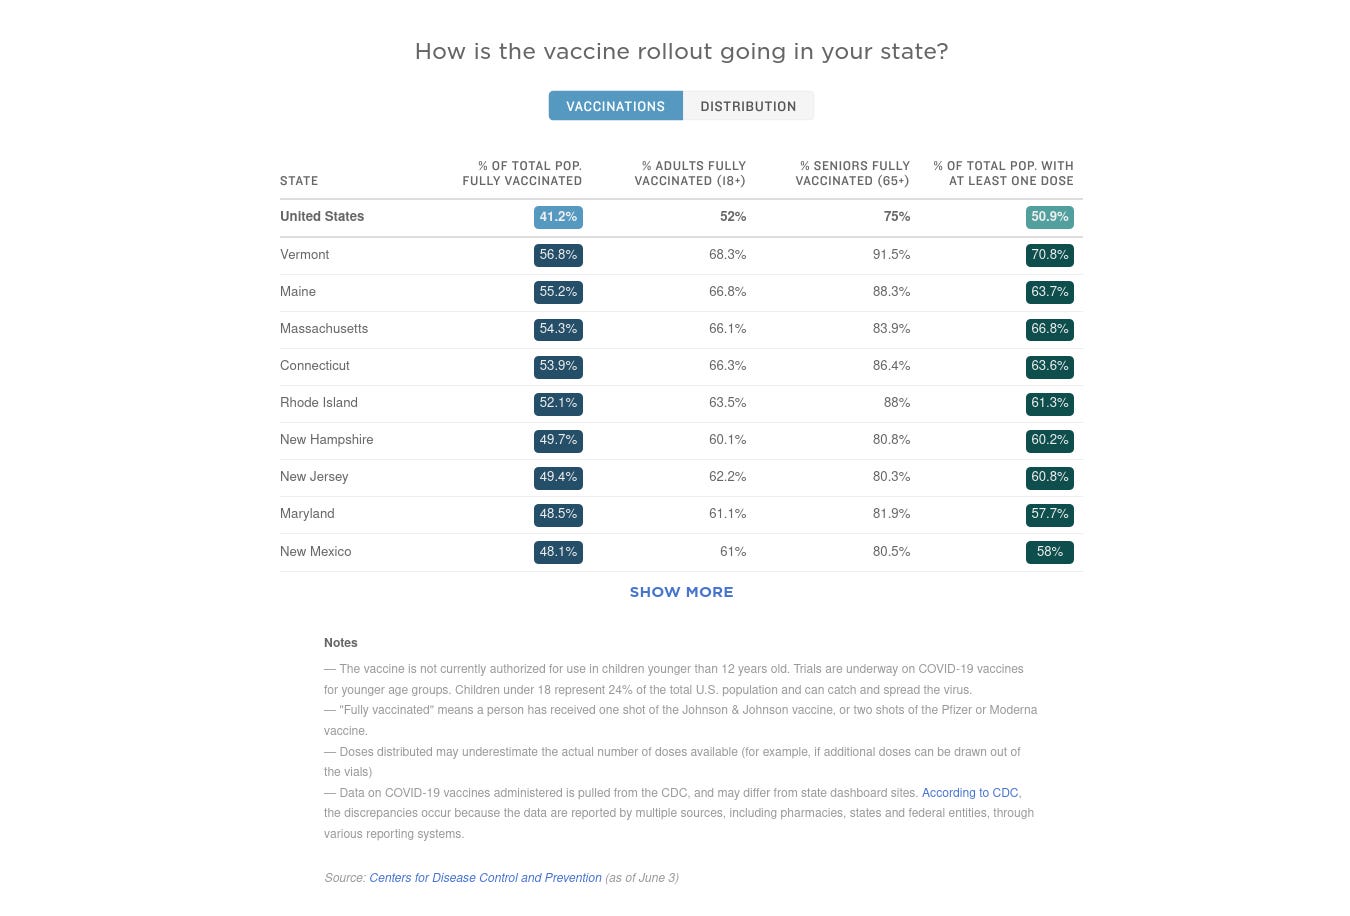
NPR reported as of June 3 that 41.2% of the US population was fully vaccinated.

Surplus COVID-19 vaccine doses will now get shipped abroad by the US to various parts of the world, including Carribean, Asian, and African nations.

Footnotes
Valenta, Philip. “Death by COVID-19 Hides in Plain Sight.” HedgeHound (June 29, 2020). The research includes the methodology behind the figures presented here every week, as well as information on historical pneumonia trends and death categorization in the US during the global pandemic. It was last updated on December 4, 2020.