


04302021 :: Friday finance

A partial digest:
Thursday was day 100 of the Biden-Harris administration. Meanwhile, another stimulus package is being floated.
US GDP grew at an annualized rate of 6.4%. PCE was high at 10.7%, while the PCE price index came in at 3.5%. One should remember that these figures were facilitated by stimulus checks, and those are fleeting. In quarters where little to no fiscal aid was provided to the general population in 2020 or prior years, PCE was predictably much lower.
What this signifies, in part, is that we still have no reason to expect sustained systemic inflation, yet.
Quick wrap:
Yields rose to finish above 1.625 on the 10Y.
The DXY finished up.
Oil finished up.
CALL: No change; near to semi-intermediate term, prices could rise further given supply shocks, OPEC+ micromanagement, inflation expectations, "recovery," and more fiscal spending, among other things. Longer term, it's a dying industry.[tracking: XLE, DRIP]The S&P Global Clean Energy index finished down for the week.
[tracking: TAN]Gold finished slightly down for the week.
CALL: No change; expecting ever-lower valuations moving forward. Looking for an eventual floor around $1,200/oz.[tracking: JDST, GDX, GLD, SLV]Total crypto market cap is nearing $2.18 trillion, meaning inflows of approximately $40 billion since last reading. Elsewhere in the space, cryptofans will have to hurry up and wait a little longer for the SEC to make up its mind on a bitcoin ETF.
The Fed is being sued again over its allowance limit on debit card transaction fees charged by banks to retailers. The cap is currently $0.21, even though over time, the estimated cost to banks fell to $0.036 per swipe as of 2017. These fees mean billions for banks.
The St. Louis Fed Financial Stress Index (STLFSI2) ticked up to -0.8052 for the week ending April 23, though it remains well below zero, or “normal financial market conditions.”
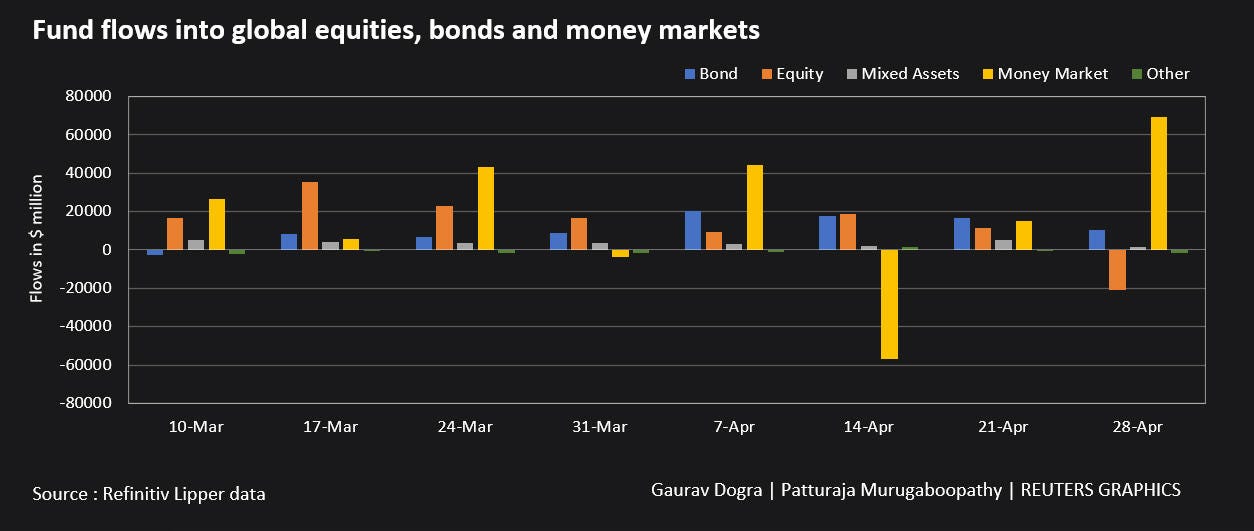
Flows for the week ending April 28, per Refinitiv:
Global money markets saw inflows of $69.16 billion.
Global equities saw outflows of $15.3 billion.
Global Bond inflows slowed to $10.3 billion.

US equities saw outflows of $22.1 billion.
European equities saw inflows of $11.1 billion.
Emerging Markets saw inflows of $657 million.
Precious metals saw minor inflows, oil saw outflows.
Initial jobless claims in the US for the week ending April 24 declined to 553k (SA) from an upwardly revised 566k for the week prior. One year ago, we saw close to 3.5 million. We are now in the one year ago timeframe where the US has been square in the grips of the pandemic. The four week moving average decreased to approximately 612k.
To add to this, nearly 122k on an unadjusted basis applied for PUA, down from the previous week’s upwardly revised 133k+.
As of April 10, over 16.5 million people (UA) were still claiming unemployment benefits of some kind, down almost 850k from the week prior. In the comparable week one year ago, the US witnessed more than 16.3 million people claiming unemployment insurance from all programs together.
Almost all programs saw declines in continued claims for the week in question from the week prior.
These numbers are still cause for concern, though it will be interesting to see if we can drop (and stay) below last year’s number of total continued claims for any comparable week moving forward.
Mortgage applications fell a blended 2.5% (SA) for the week ending April 23, due to a decrease of 1% in refis and 5% in homebuyer applications. ARM activity fell slightly to 3.5% of all applications.
The release once again neglected to mention the average loan size across purchase applications. MBA’s choice for a 30Y fixed benchmark declined further to 3.17%. The simple national average as reported by Freddie Mac (via FRED) for April 29 was 2.98% on the 30Y fixed, up just one basis point from that reported last week.
At the same time, the forbearance rate as of April 18 fell ever so slightly to 4.49%, with seemingly fewer households making their exit in one way or another. Exits, the good, the bad, and the ugly, were picking up as we marked roughly 14 months of being beset by the pandemic in the US, until this latest week of data.
Loan deferrals and partial claims increased, as did the share of people engaging in loan or trial loan modifications. Finally, the group that continues to make their monthly payments during their forbearance period shrunk again.
MBA estimates that 2.25 million households remain in a state of mortgage forbearance.

GoBankingRates compiled a list of 50 locales where the housing market may be turning sour as we speak. Most of them are in just a few states, including California, Illinois, Louisiana, and Texas. However, the nationwide housing market continues to have its cheerleaders.
CALL: No change; housing weakness inbound. For the call to reverse, labor conditions would have to consistently improve, among other things. A giantinfrastructurebill could help, but thefightis on.[tracking: DRV, XLRE, SPG, VNO, WPG, NLY]Used car trends: The latest Carvana car count as of April 30 jumped 10.18% to 37,735 vehicles from 34,248 the week prior. The four-week moving average came in at 34,446. Meanwhile, the CarGurus average price index continued rising, this time by 1.70% to $24,438 from $24,029. This is a new high for the index since said data collection began for this newsletter in November of last year.

Sovereign matters:
Vanguard pulled out of the competition over standalone licensing to serve the Chinese market with mutual funds. They’ll look to partner with Ant Group on an advisory business arrangement instead.
China’s growth trajectory is already looking less impressive, again. Meanwhile, the nation forges ahead with the e-CNY, its digital currency. Also, it's state-owned bad loan bank, Huarong, is displeased with recent ratings agency downgrades, stating everything’s fine, nothing to see here.
S&P Global upgraded Greece citing subsiding pandemic factors.
Traders appear to be treating Colombia's debt like junk.
[tracking: EDC]
The current state of equity: The full Congress will finally consider H.R. 40 (“Commission to Study and Develop Reparation Proposals for African-Americans Act”) for the first time since its initial introduction in the late 1980s.
During the pandemic alone, the US has witnessed 213,130 fatalities strictly classified as “pneumonia” with no acknowledgement of COVID-19 on the death certificates, per CDC excess deaths data. This equates to an average of 437 people per day since the start of 2020. As the CDC points out, many of these could be miscategorized COVID-19 fatalities going unrecognized in official tallies, meaning we’re undercounting. This, in addition to the official coronavirus death toll of 582,838, puts the probable COVID-19 death figure somewhere north of 690k.
Across all causes of death, we suffered 119% of the deaths in 2020 that we would have expected in non-pandemic times given historical trends. Along with other situations where COVID-19 was not designated as a cause of death but where SARS-CoV-2 likely triggered a condition or exacerbated a preexisting one—heart disease, hypertension, diabetes, dementia—the “real” fatality count is probably much higher.1
When the average of “pneumonia” deaths per day begins to decline significantly and consistently, perhaps we'll be able to start saying that we might be gaining the upper hand on SARS-CoV-2. We’re not there yet.
NPR reported that 30% of the population in the US had been fully vaccinated, up from 27.5% last week. However, the vaccination rate is definitely slowing, coming in at 2.5% for the week. The vaccination rate hit as high as 5%/week not long ago.
Perhaps it’s that vaccine wall.


Footnotes
Valenta, Philip. “Death by COVID-19 Hides in Plain Sight.” HedgeHound (June 29, 2020). The research includes the methodology behind the figures presented here every week, as well as information on historical pneumonia trends and death categorization in the US during the global pandemic. It was last updated on December 4, 2020.