


03262021 :: Friday finance

A partial digest:
Friday was day 66 of the Biden-Harris administration.
Two weeks have passed of volatile and/or lukewarm market activity since passage of the last stimulus act, seemingly in spite of moments of falling yields. Additionally, more stimulus 3.0 checks went to those in need, while the wealthiest Americans didn’t get any. Hence, it’s not totally surprising that it wasn’t much of a boon for stocks. It’s worth reiterating, then, that perhaps markets are finally needing fundamentals for fuel, not government checks and empty words. Massive infrastructure spending could help.
Quick wrap:
Yields tightened heading into Yellen/Powell congressional testimony in the first half of the week, though this didn’t spell immediate relief for equities. Then by Friday close, they had climbed again to 1.67 on the 10Y.
Gold had a volatile week before ending lower.
CALL: No change; lower valuations moving forward.Oil had a rough time, what with renewed concern over a global resurgence in infections, shutdowns, and poor overall demand. However, it finished mostly flat for the week, thanks to the Suez Canal blockage, some say.
CALL: No change; near to semi-intermediate term, prices could rise further given supply shocks, OPEC+ micromanagement, inflation expectations, and more fiscal spending, among other things. Longer term, it's a dying industry.[tracking: XLE, GUSH, DRIP]Crypto has slipped to about $1.7 trillion in market cap as of publication. Several alt-coins climbed to new heights, however, even as majors like BTC and ETH corrected.
That DXY, again. It neared 93 for the week.
Companies are going bankrupt at a decent clip, still, as measured by Chapter 11 filings.
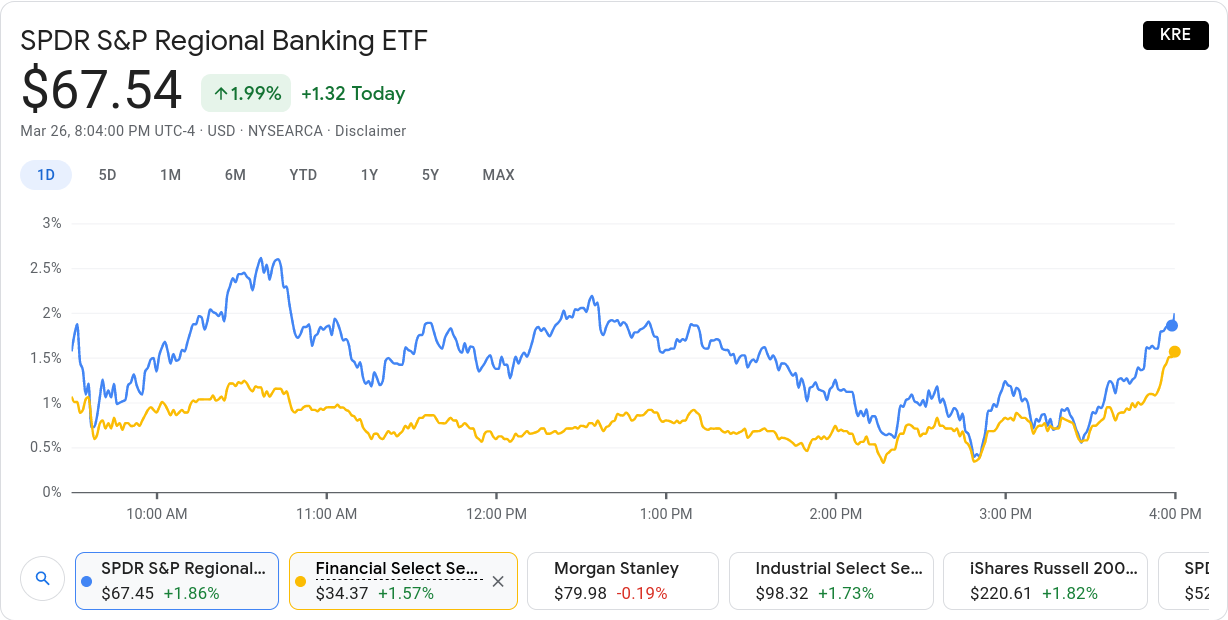
Restrictions on banks buying back shares or paying out dividends are to be lifted June 30.

[tracking: XLF, KRE]
A reminder that the Fed is actively seeking systemic inflation. We still don’t have it; the February PCE came in at 1.6% YoY, and just 0.2% MoM. This is a far cry from any sustained 2%+ average inflation objective.
Personal income, disposable income, and expenditures were down for February. Money velocity remains completely depressed. There is no serious data that supports the notion that we are in an inflationary environment.
Remember that inflation is too much money chasing too few goods. There’s a verb in there: chasing. Some folks are up in arms about how much money is out there, how much has been “printed,” but on its own, it matters little what amount is in circulation. If the money’s not chasing goods, and a relatively scarce quantity of goods at that, then it’s not inflation.
CALL: The Fed has its work cut out for it. Deep fiscal spending could help the monetary authority achieve the prolonged inflation they are targeting. Treasury and the Fed will likely have to work in concert.Initial jobless claims came in sub 700k for the first time during the pandemic’s fallout in the US. Again, these figures keep getting revised upward the following week, so it may turn out later that they were above 700k after all. Also, this doesn’t mean people are returning to work. Yet, this reading is noteworthy.
Specifically, claims fell to 684k (SA) for the week ending March 20 from an upwardly revised 781k for the week prior. One year ago, we saw roughly 3.3 million. To repeat, we are entering the one year ago timeframe when the US began to feel the brunt of the pandemic.
To add to this, almost 242k on an unadjusted basis applied for PUA, down from the previous week’s upwardly revised 284k+.
As of March 6, nearly 19 million people (UA) were still claiming unemployment benefits of some kind, up some 734k from the week prior. In the comparable week one year ago, the US witnessed closer to 2 million people claiming unemployment insurance from all programs together.
Across the board, UI benefits programs saw increases in continued claims for the week in question from the week prior. The PEUC program saw the largest jump of almost 735k as people worked their way through the UI benefits ecosystem on their way to running out of benefits altogether.
Mortgage applications decreased a blended 2.5% (SA) for the week ending March 19, due to a decrease of 5% in refis and in spite of a 3% increase in homebuyer applications. ARM activity rose to 3.2% of all applications.
The report once again neglected to mention the average loan size across purchase applications, but remarked that it increased. MBA’s choice for a 30Y fixed benchmark came in higher at 3.36%. The simple national average as reported by Freddie Mac (via FRED) for March 25 was 3.17% on the 30Y fixed.
At the same time, the forbearance rate as of March 14 fell slightly to 5.05% as some households made their exit in one way or another. Exits, the good, the bad, and the ugly, are expected to pick up now and into April as we mark a year of being beset by the pandemic in the US.
Of concern is that the relative number of households extending their original forbearance periods keeps growing, while those continuing to make payments in these days of forbearance shrinks. Moreover, the percentage of households that missed payments, and are now exiting forbearance without a loss mitigation plan in place, keeps rising.
Home sales figures for February weren’t great. New home sales fell over 18% to levels not seen since May-June 2020, with the median new home sales price coming in at a higher $349,400. Simultaneously, existing home sales fell 6.6%, with the median existing home price rising to $313k and inventory at a mere 1.03 million units. One could argue that existing home sales will fall in part because of inventory woes, but the reality that new home sales took such a hit indicates that there is more trouble brewing than just low supply, rising prices, and more expensive mortgages.
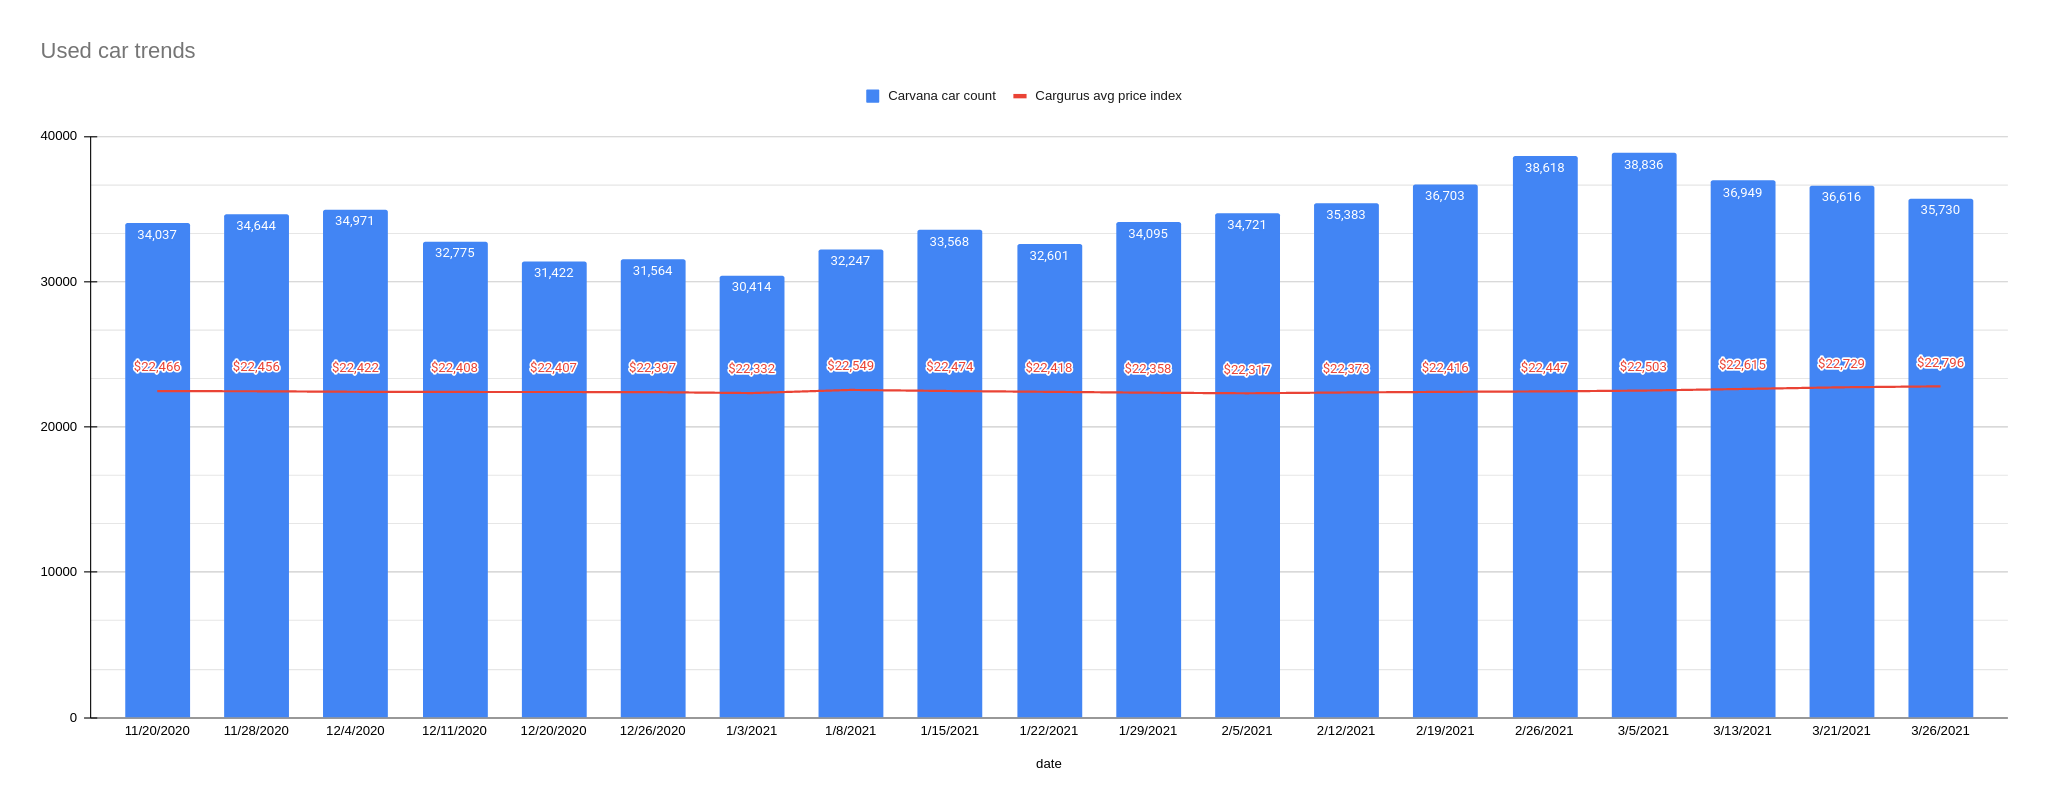
CALL: No change; housing weakness inbound. If anything, additional data points reinforce this. That said, the housing market fallout lasted multiple years last go around, from 2005-2012 by some estimates. This is not something that will unfold overnight. For the call to reverse, labor conditions would have to improve, among other things. Again, how about that giantinfrastructurebill.[tracking: DRV, XLRE, SPG, VNO, WPG]Used car trends: The latest Carvana car count as of March 26 dropped 2.42% to 35,730 vehicles from 36,616 the week prior. Meanwhile, the CarGurus average price index continued rising by 0.29% to $22,796 from $22,729.

Sovereign matters:
S&P Global downgraded Chile on analysis that the country’s public finances have deteriorated over the last decade, and political pressure to spend more will persist. The ratings agency projects that Chile will emerge from the pandemic in a weakened state.
Fitch revised upward Iraq’s outlook to stable from negative, crediting the nation’s higher forex holdings than expected at this time, as well as healthier oil prices and some movement in the direction of financial reforms.
Turkey’s Erdogan axed his third central bank chief over his unique conclusions on the relationship between interest rates and inflation.
[tracking: EDC/EDZ, VWO, EWU, IEV]
The current state of equity: Voting accessibility in the US is under attack.
As of the CDC's March 26 update, the US had witnessed 198,694 fatalities strictly classified as “pneumonia” with no acknowledgement of COVID-19 on the death certificates, per excess deaths data. That’s an average of 441 people per day since such data reporting began early last year. As the CDC points out, many of these could be miscategorized COVID-19 fatalities going unrecognized in official tallies, meaning we’re undercounting. This, in addition to the official coronavirus death toll of 547,573, puts the probable COVID-19 death figure somewhere north of 650k.
Across all causes of death, we suffered 118% of the deaths in 2020 that we would have expected in non-pandemic times given historical trends. Along with other situations where COVID-19 was not designated as a cause of death but where SARS-CoV-2 likely triggered a condition or exacerbated a preexisting one—heart disease, hypertension, diabetes, dementia—the “real” fatality count is probably much higher.1
When the average of pneumonia deaths per day begins to decline significantly and consistently, perhaps we'll be able to start saying that we might be gaining the upper hand on SARS-CoV-2. We’re not there yet.
NPR reports that some 14.3% of the population in the US has been fully vaccinated, up from 12.6% last week. The vaccination rate is has been roughly 2%/week for a couple of weeks.

Interestingly, those who have been ill with COVID-19 already may be good with only the first shot of any two-dose vaccine, says a recently published study.

Footnotes
Valenta, Philip. “Death by COVID-19 Hides in Plain Sight.” HedgeHound (June 29, 2020). This research includes the full methodology behind the figures presented here every week, as well as historical pneumonia trends and other details regarding death categorization in the US during the global pandemic. It was last updated on December 4, 2020.