

04232021 :: Friday finance
04232021 :: Friday finance

A partial digest:
Friday was day 94 of the Biden-Harris administration. There is a proposal to raise capital gains taxes a significant amount to the highest the rate has been post WWII, but only for a very small percent of wealthier individuals. Raising the top marginal income tax rate is being floated, as well. Traditional financial markets didn’t take long to shake it off, though. Crypto has been another story, which may say something about who owns a good chunk of it.
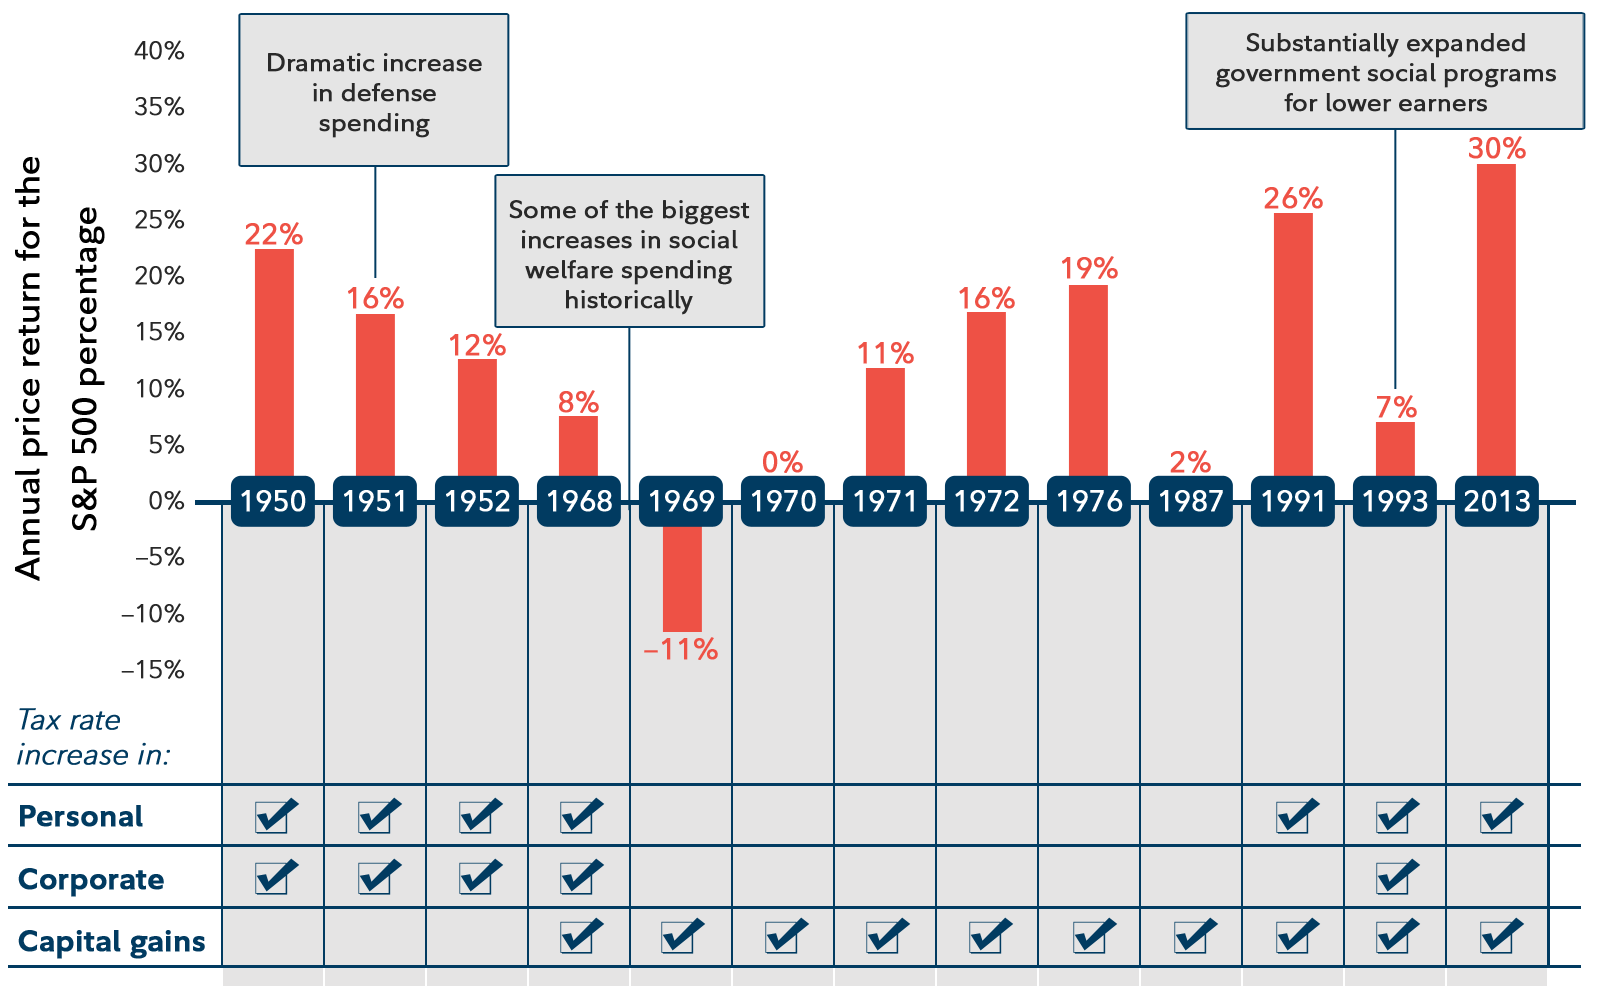
While on the topic, a brief review of the history of capital gains taxes is in order. The record reveals that capital gains taxes were raised 10 times since 1950. Almost every year it happened, the percentage annual average price return for the S&P 500 was positive. In years where it was the only type of tax raised among a group of three including personal and corporate taxes, the S&P 500 even saw bumper returns of 16% and 19%, in 1972 and 1976, respectively.
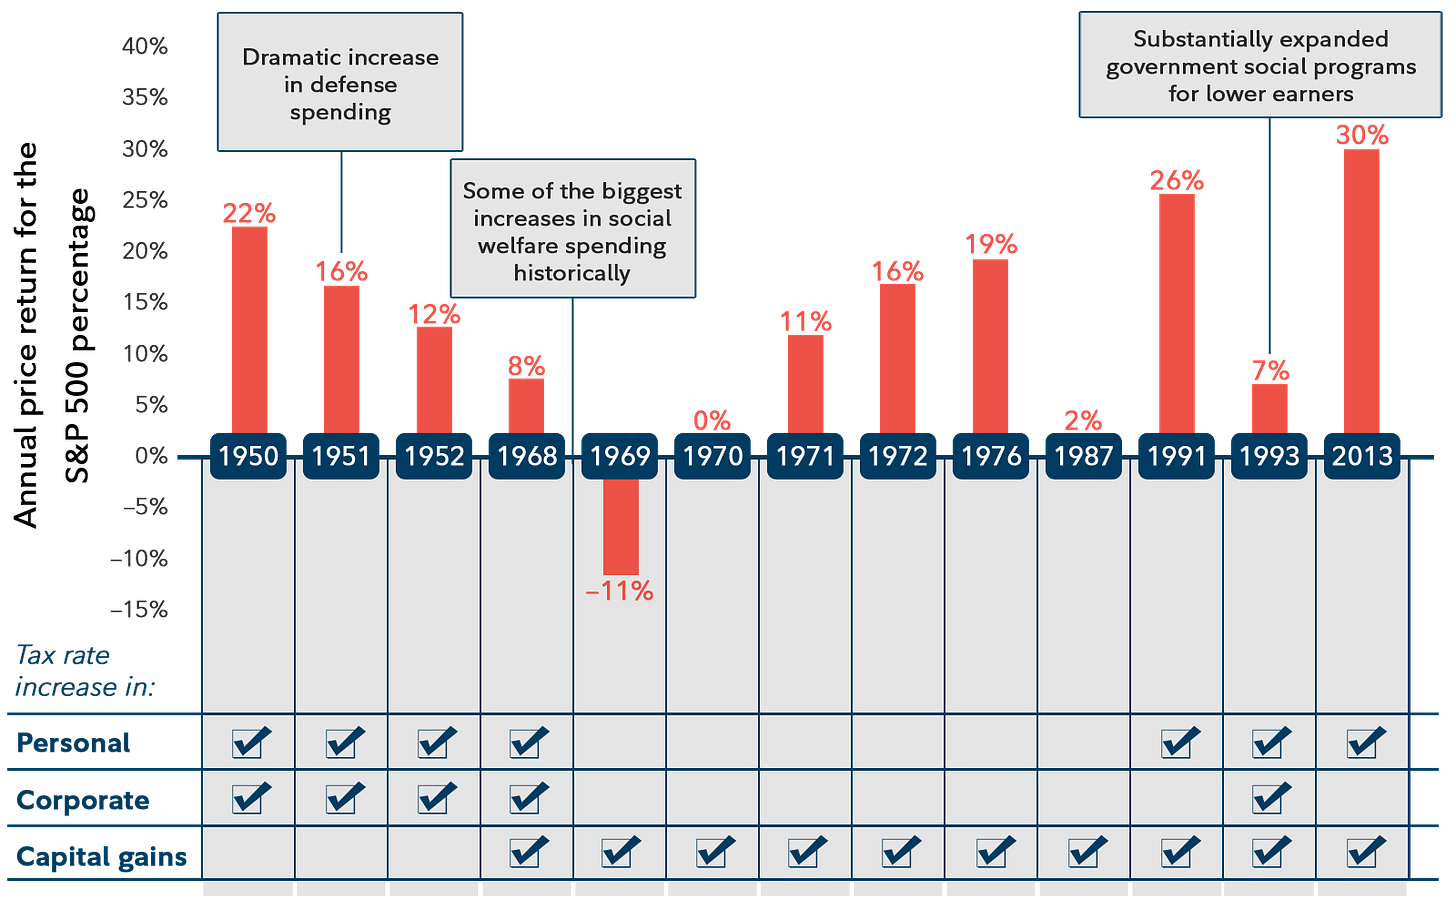
Source: Fidelity The key is to always understand what else is co-occurring in that moment. Frequently, there is additional fiscal spending that may be helping to boost returns, just as there is now (not to mention what else is on the table with future infrastructure and so on). “There is never ‘one thing’ for the market.”1 Hence, we would not expect all market action to be reduced to the single driver of a capital gains tax increase.
Besides, it is not clear where the real capital gains tax rate will end up when all is said and done.
Will there be unintended consequences? That’s nearly a given; there pretty much always are. But where else is the money of those most impacted going to go if not to make more money? Will those people really give up entirely on seeking capital gains in the United States because they may pay more in taxes? Doubtful. They will attempt to find some other way around the hike, if history is any judge, but the investing will most likely continue.
Quick Wrap:
FXHedge deleted the completely unverifiable post that caused commotion last weekend in the crypto space. Big surprise.
Yields have fallen and stayed down.
The DXY took a dive for the week.
Crude finished slightly down.
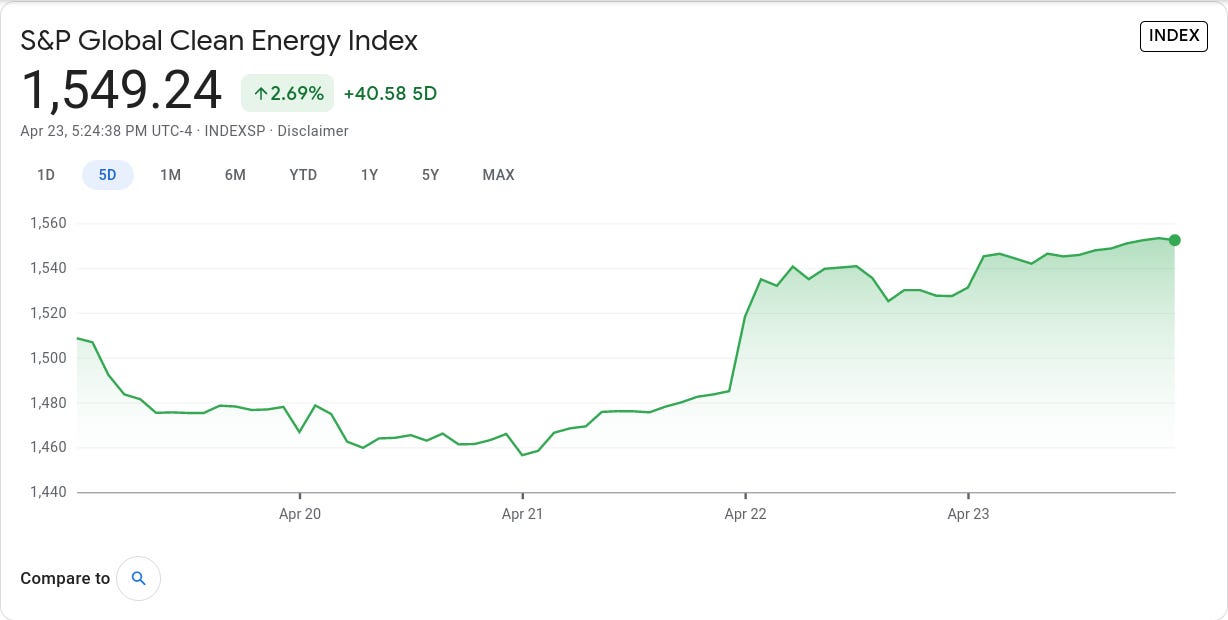
CALL: No change; near to semi-intermediate term, prices could rise further given supply shocks, OPEC+ micromanagement, inflation expectations, "recovery," and more fiscal spending, among other things. Longer term, it's a dying industry.[tracking: XLE, DRIP]Meanwhile, the S&P Global Clean Energy Index closed the week in the green given Biden’s latest on the topic.
[tracking: TAN]Gold finished nearly flat.
CALL: No change; expecting ever-lower valuations moving forward. Looking for an eventual floor around $1,200/oz.[tracking: JDST, GDX, GLD, SLV]US indices were close to flat. Dividend stocks can be solid choices for those times when assets can’t seem to pick a direction. Or, one can sell options. There’s plenty brewing to wake the markets from their sideways slumber, though, including difficult developments in the ever-present fight against SARS-CoV-2.
Total crypto market cap is sub $1.8 trillion as of publication.
Initial jobless claims fell again to 547k (SA) for the week ending April 17 from a upwardly revised 586k for the week prior. One year ago, we saw a little over 4.2 million. We are now in the one year ago timeframe with the US square in the grips of the pandemic. The four week moving average came in at 651k.
To add to this, more than 133k on an unadjusted basis applied for PUA, up slightly from the previous week’s near 132k.
As of April 3, over 17.4 million people (UA) were still claiming unemployment benefits of some kind, up almost 500k from the week prior. In the comparable week one year ago, the US witnessed close to 12.5 million people claiming unemployment insurance from all programs together.
The PEUC UI benefits program saw the largest increase of nearly 450k in continued claims for the week in question from the week prior.
These numbers are still cause for concern.
Mortgage applications increased a blended 8.6% (SA) for the week ending April 16, due to an increase of 10% in refis and 6% in homebuyer applications. ARM activity was flat at 3.6% of all applications.
The release once again neglected to mention the average loan size across purchase applications, only indicating that it increased after declining for some weeks. MBA’s choice for a 30Y fixed benchmark fell further to 3.20%. The simple national average as reported by Freddie Mac (via FRED) for April 22 was 2.97% on the 30Y fixed, down from that reported last week.
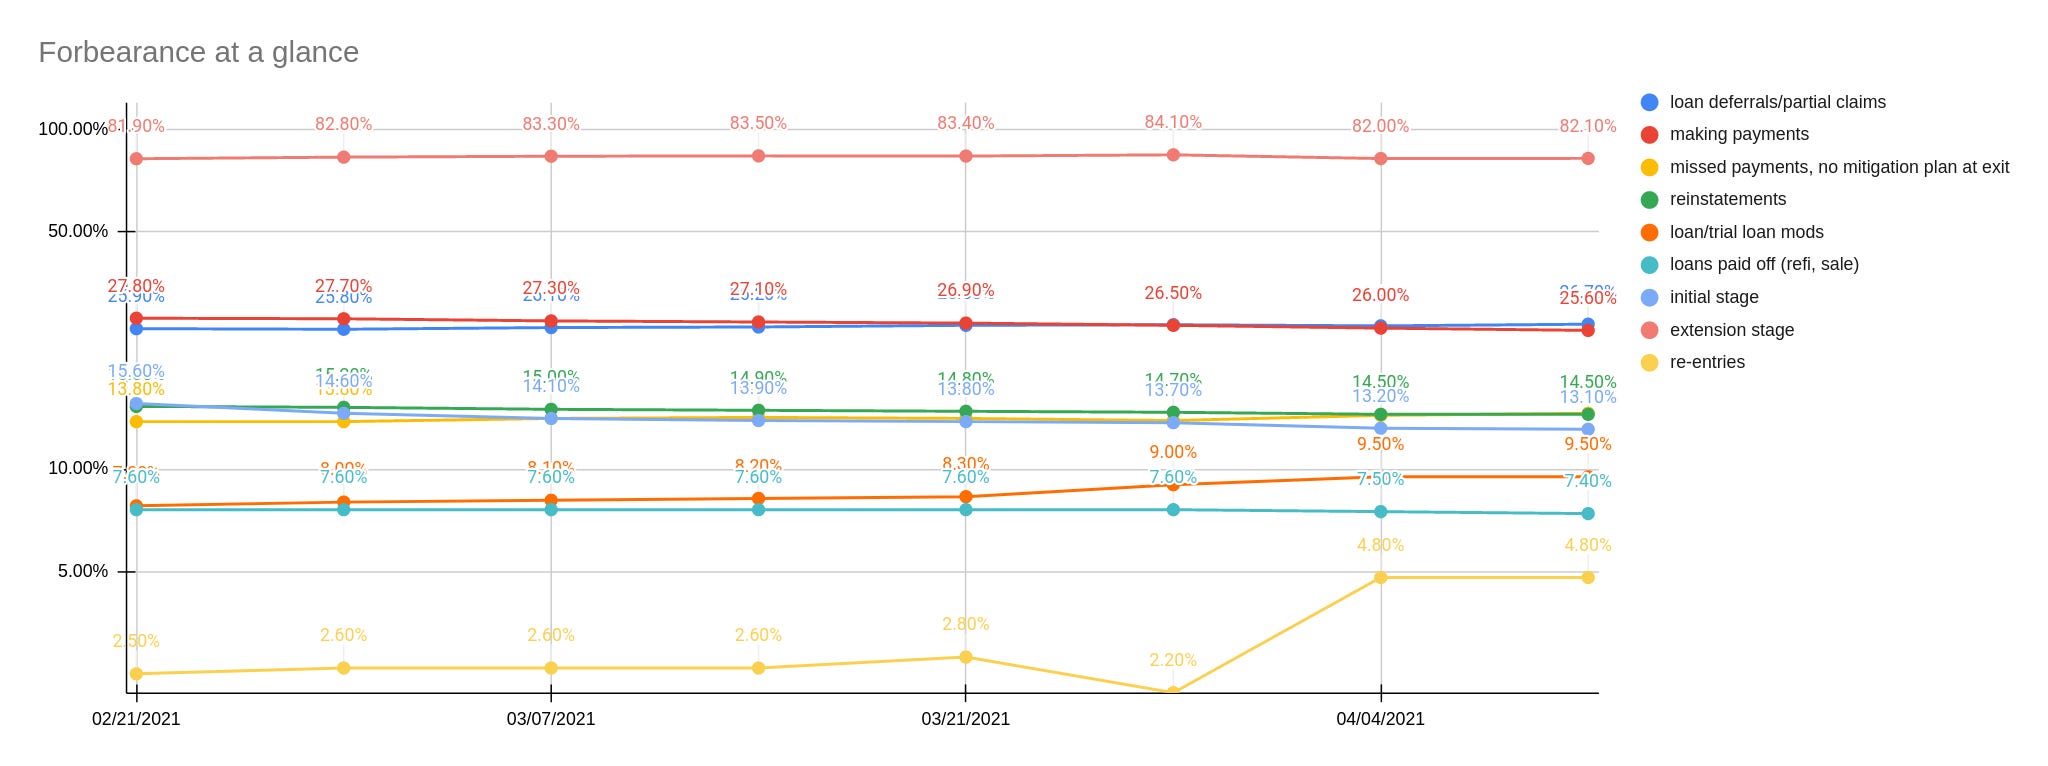
At the same time, the forbearance rate as of April 11 fell slightly to 4.50% as more households made their exit in one way or another. Exits, the good, the bad, and the ugly, are picking up as we mark one year plus of being beset by the pandemic in the US.
Loan deferrals and partial claims increased this last go around, as did the share of people exiting with no loss-mitigation plan in place after having missed payments. Finally, the group that continues to make their monthly payments during their forbearance period shrunk again.
MBA estimates that 2.3 million households remain in a state of mortgage forbearance.

All this said, new home sales for the month of March exceeded expectations.
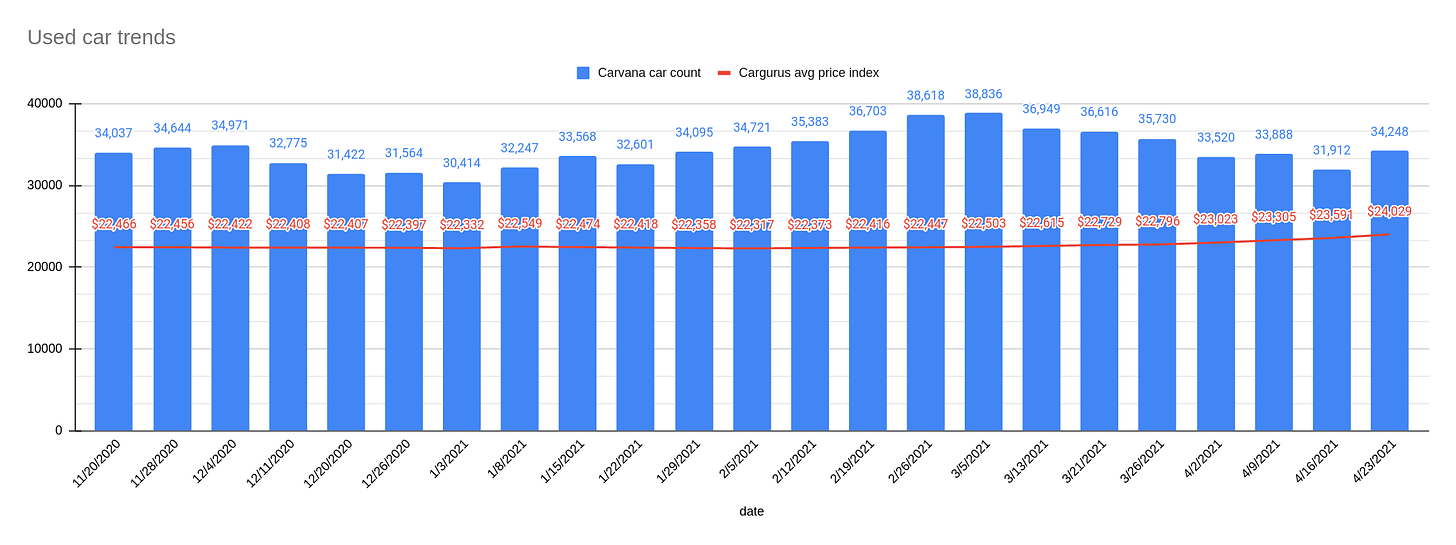
CALL: No change; housing weakness inbound. For the call to reverse, labor conditions would have to consistently improve, among other things. A giantinfrastructurebill could help, but the GOP is again looking toreducethe size and scope of yet another proposal.[tracking: DRV, XLRE, SPG, VNO, WPG, NLY]Used car trends: The latest Carvana car count as of April 23 jumped 7.32% to 34,248 vehicles from 31,912 the week prior. The four-week moving average came in at 33,392. Meanwhile, the CarGurus average price index continued rising, this time by 1.86% to $24,029 from $23,591. This is a new high for the index since said data collection began for this newsletter in November of last year.
Sovereign matters:
Things have quickly become dire in India and the nation’s healthcare system is being overwhelmed by a grave onslaught of COVID-19 as we speak. The country just set an infection record of nearly 350k new documented cases in a single day. At its worst, the US hit slightly over 300k.

S&P Global has upgraded Taiwan on account of its handling of the pandemic, low indebtedness, and competitive private industry, among other things. The ratings agency anticipates that demand for the country’s electronics exports will further solidify its growth prospects.
Ethiopia entered into a $907 million financing agreement with the World Bank.
[tracking: MCHI, EDC/EDZ, VWO, EWU, IEV]The current state of equity: The race of curfew citations.
During the pandemic alone, the US has witnessed 209,839 fatalities strictly classified as “pneumonia” with no acknowledgement of COVID-19 on the death certificates, per CDC excess deaths data. This equates to an average of 437 people per day since the start of 2020. As the CDC points out, many of these could be miscategorized COVID-19 fatalities going unrecognized in official tallies, meaning we’re undercounting. This, in addition to the official coronavirus death toll of 571,471, puts the probable COVID-19 death figure somewhere north of 680k.
Across all causes of death, we suffered 119% of the deaths in 2020 that we would have expected in non-pandemic times given historical trends. Along with other situations where COVID-19 was not designated as a cause of death but where SARS-CoV-2 likely triggered a condition or exacerbated a preexisting one—heart disease, hypertension, diabetes, dementia—the “real” fatality count is probably much higher.2
When the average of “pneumonia” deaths per day begins to decline significantly and consistently, perhaps we'll be able to start saying that we might be gaining the upper hand on SARS-CoV-2. We’re not there yet.
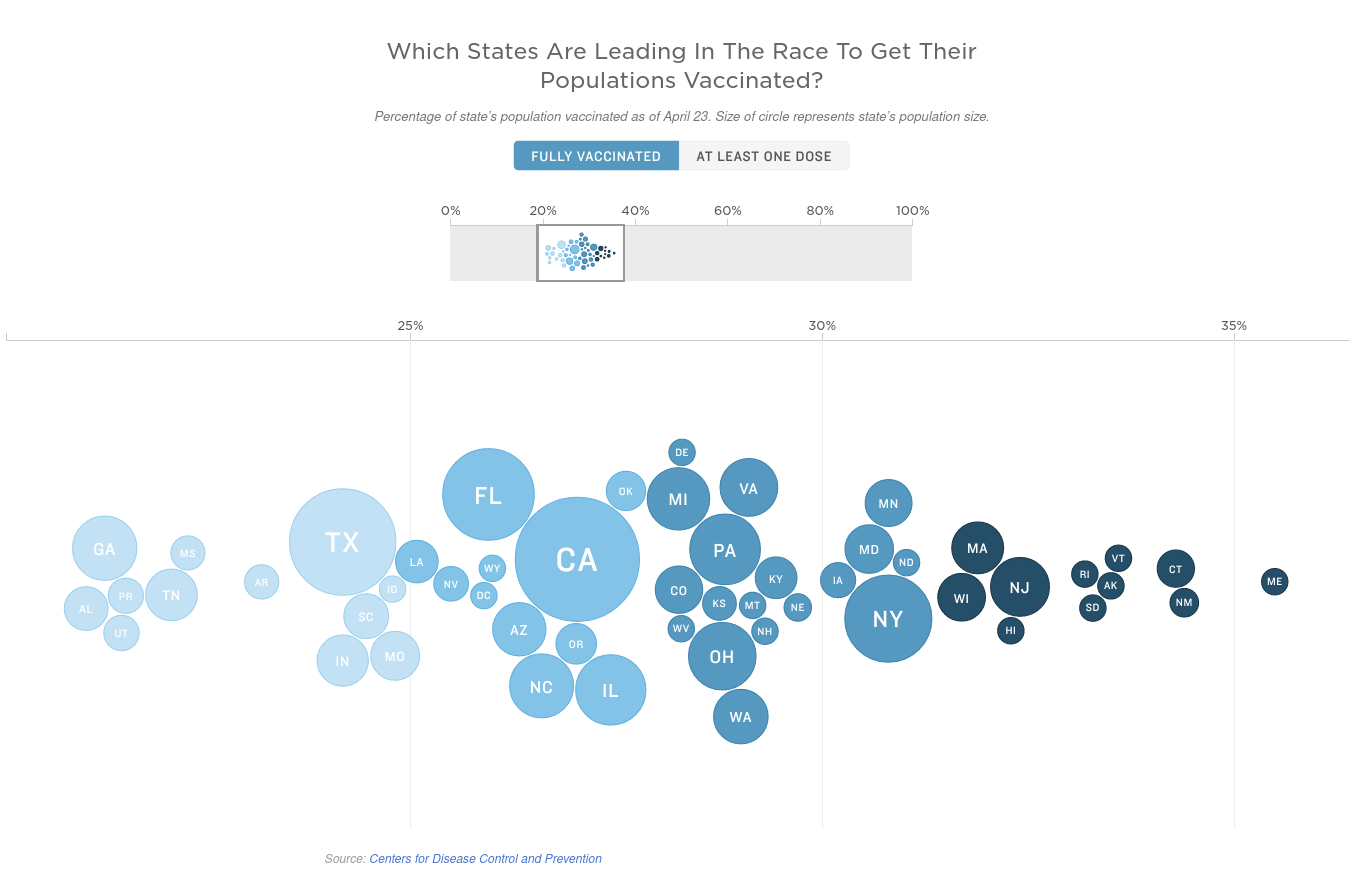
NPR reports that some 27.5% of the population in the US has been fully vaccinated, up from 24.8% last week. The vaccination rate was roughly 2%/week for a few weeks, then 3%/week for a couple of weeks, then hit 5%/week last week. However, it has now slowed to less than 3%/wk this go around.
It was already suggested earlier that we could hit a “vaccine wall” at some point, and the data may be showing signs of that now.


Footnotes
“History lessons from past tax hikes.” Fidelity Viewpoints (September 30, 2020).
Valenta, Philip. “Death by COVID-19 Hides in Plain Sight.” HedgeHound (June 29, 2020). The research includes the methodology behind the figures presented here every week, as well as information on historical pneumonia trends and death categorization in the US during the global pandemic. It was last updated on December 4, 2020.